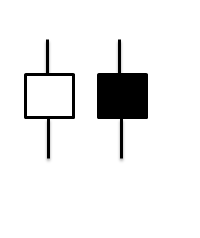
This pattern consists of a small candle body with long tail below and above the body, it can either be a black or white body.
Found at the top of an up trend or the end of a down trend, this pattern is a strong indicator.
It indicates that the sentiment of the market is the same and nothing has really changed, the bulls and the bears cannot seem to take control, they do try to drive the price to a high or a low but in the end they can't take possession or maintain their force.
This pattern therefore is a clear and strong indicator of indecision within the markets.
Please click on picture above to get a larger picture
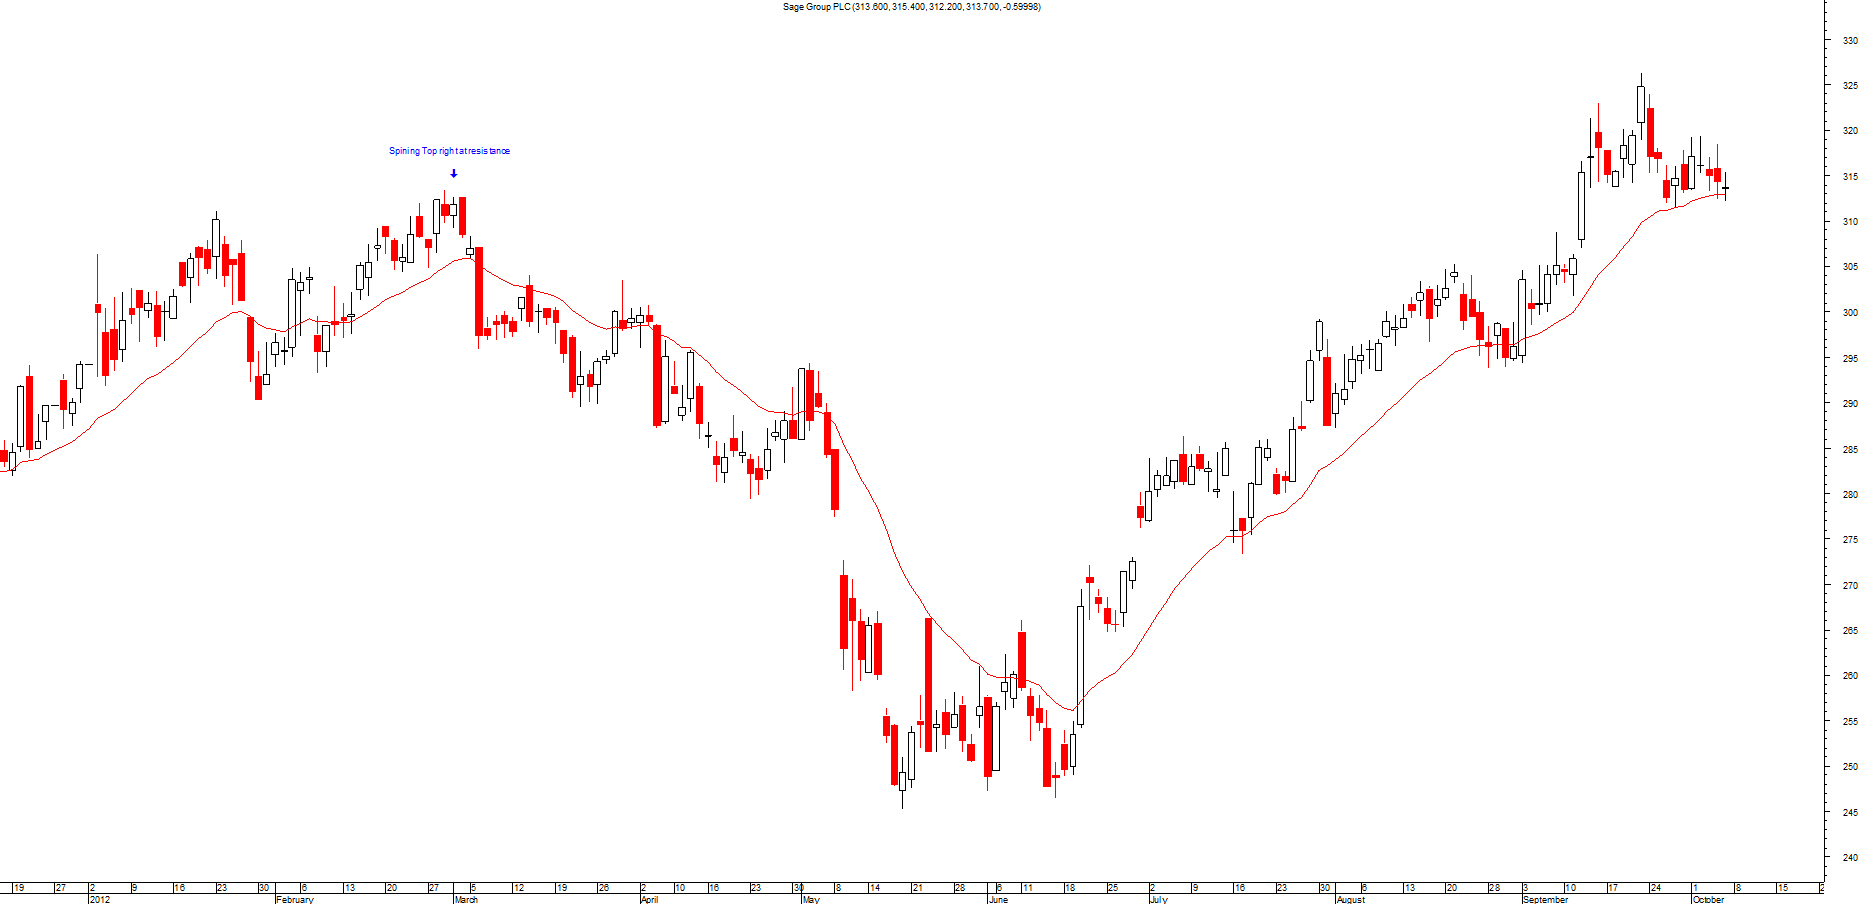
Most candlestick patterns should appear close to previous resistance or support levels depending on what type it is. You should only trade a candlestick pattern if it's near these levels.
Don't trade using these patterns if it's not at the top or bottom of a trend. These patterns appear a great deal so you have to make certain you only trade at the right level.
This is very important as you will end up over trading them and you will end up losing more money than you imagined.
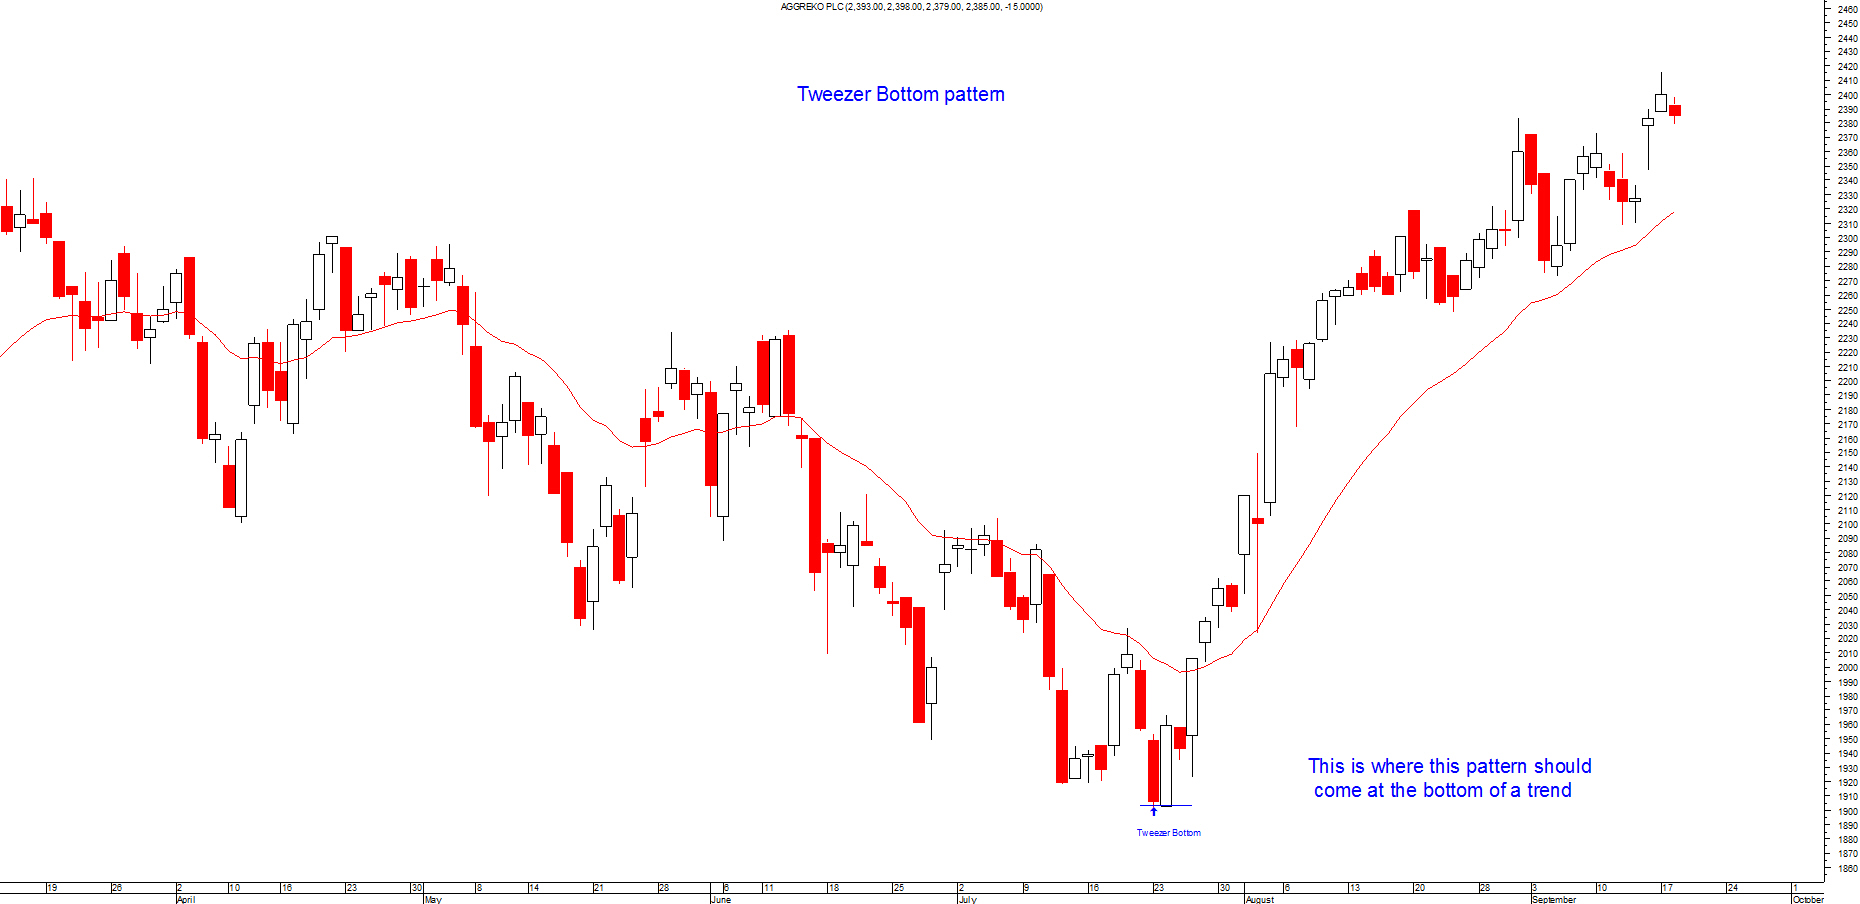
This pattern consists of two candles representing two consecutive days. Usually found at the end of a down trend, it starts bearish with a large black candle on the first day however things soon change on the second day.
The bulls are in complete control as they open at the same price as the previous day but draw the price up to a new high on which it closes.
The extremes are roughly the same, taking the shape of a tweezer. This pattern can signal a change of feeling in the market to more of a bullish nature.
Please click on picture above to get a larger picture
Most candlestick patterns should appear close to previous resistance or support levels depending on what type it is. You should only trade a candlestick pattern if it's near these levels.
Don't trade using these patterns if it's not at the top or bottom of a trend. These patterns appear a great deal so you have to make certain you only trade at the right level.
This is very important as you will end up over trading them and you will end up losing more money than you imagined.
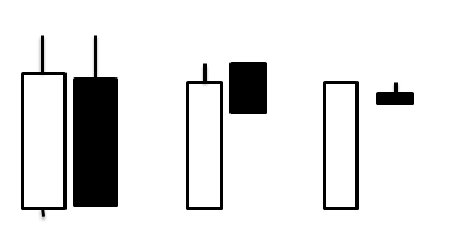
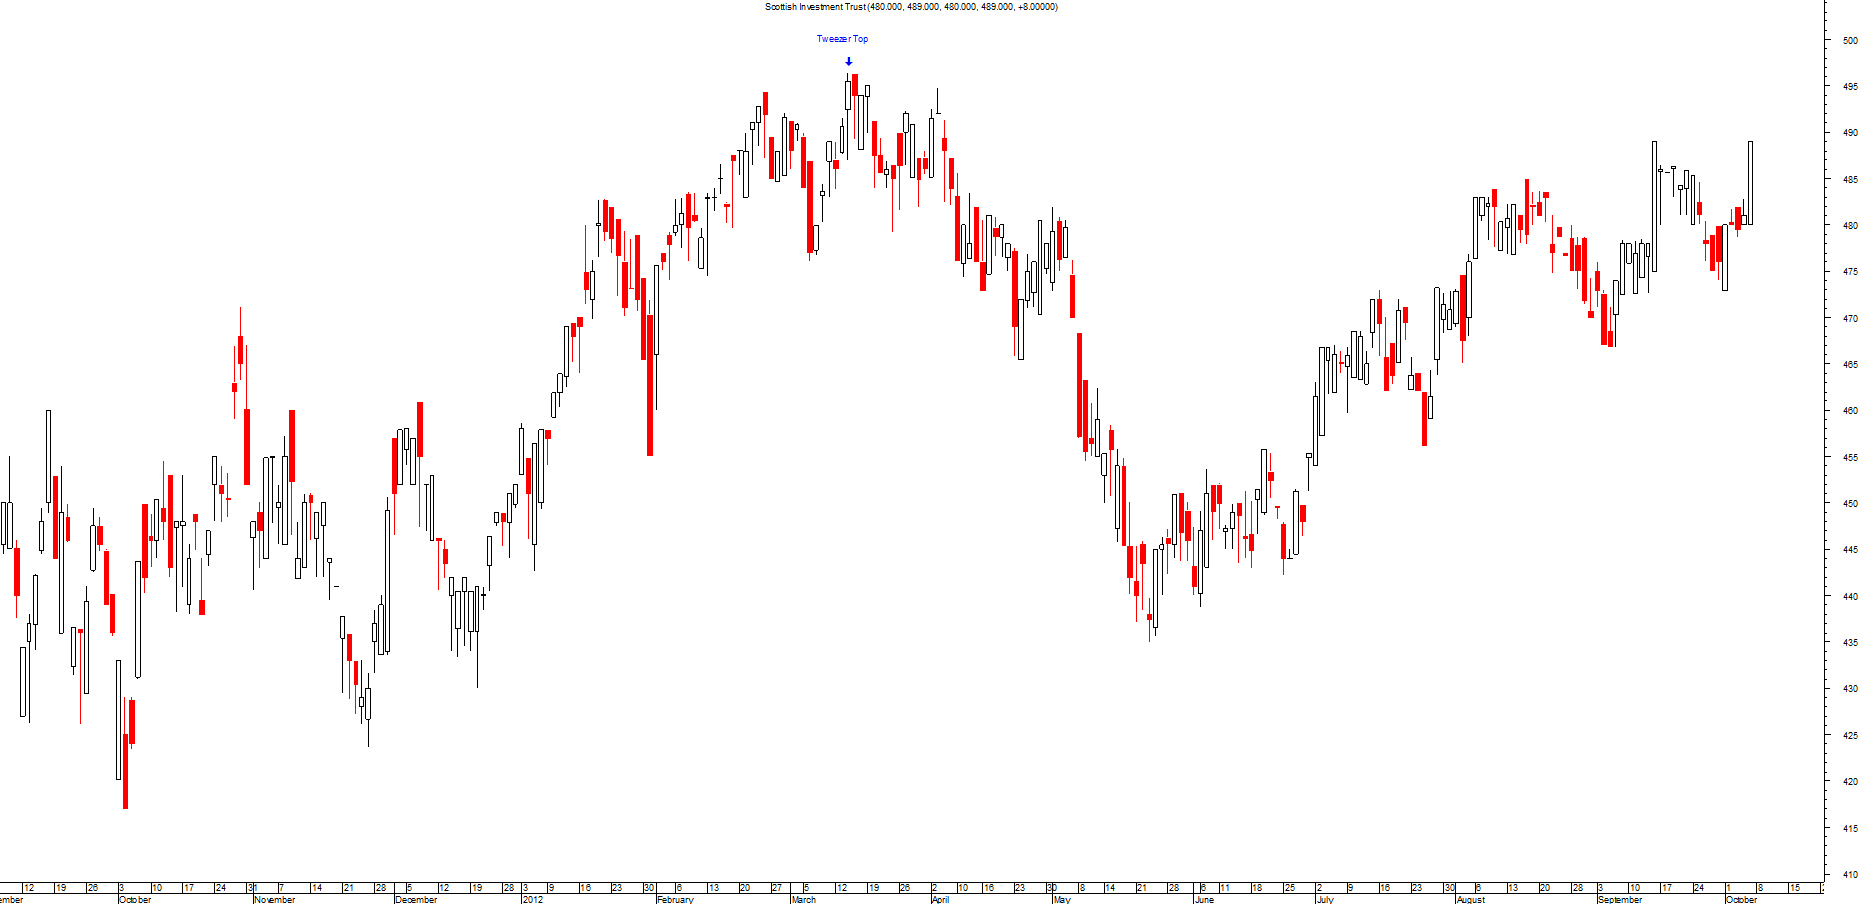
This pattern consists of two candles representing two consecutive days. Usually found at the top of an up trend, it starts bullish with a large white candle on the first day however things soon change on the second day.
The bears are in complete control as they open at the same price as the previous day but draw the price down to a new low on which it closes.
The tops are roughly the same hence the tweezers look. This pattern can take a different shape as well as even a flat top could be classed as a tweezer top.
This pattern can signal a change of feeling in the market to more of a bearish nature.
Please click on picture above to get a larger picture
Most candlestick patterns should appear close to previous resistance or support levels depending on what type it is. You should only trade a candlestick pattern if it's near these levels.
Don't trade using these patterns if it's not at the top or bottom of a trend. These patterns appear a great deal so you have to make certain you only trade at the right level.
This is very important as you will end up over trading them and you will end up losing more money than you imagined.
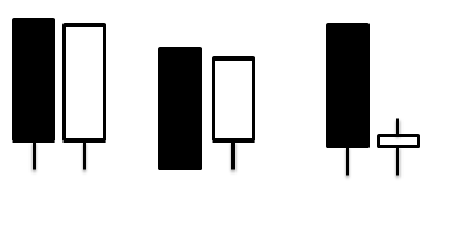
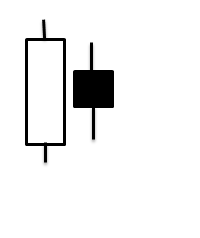
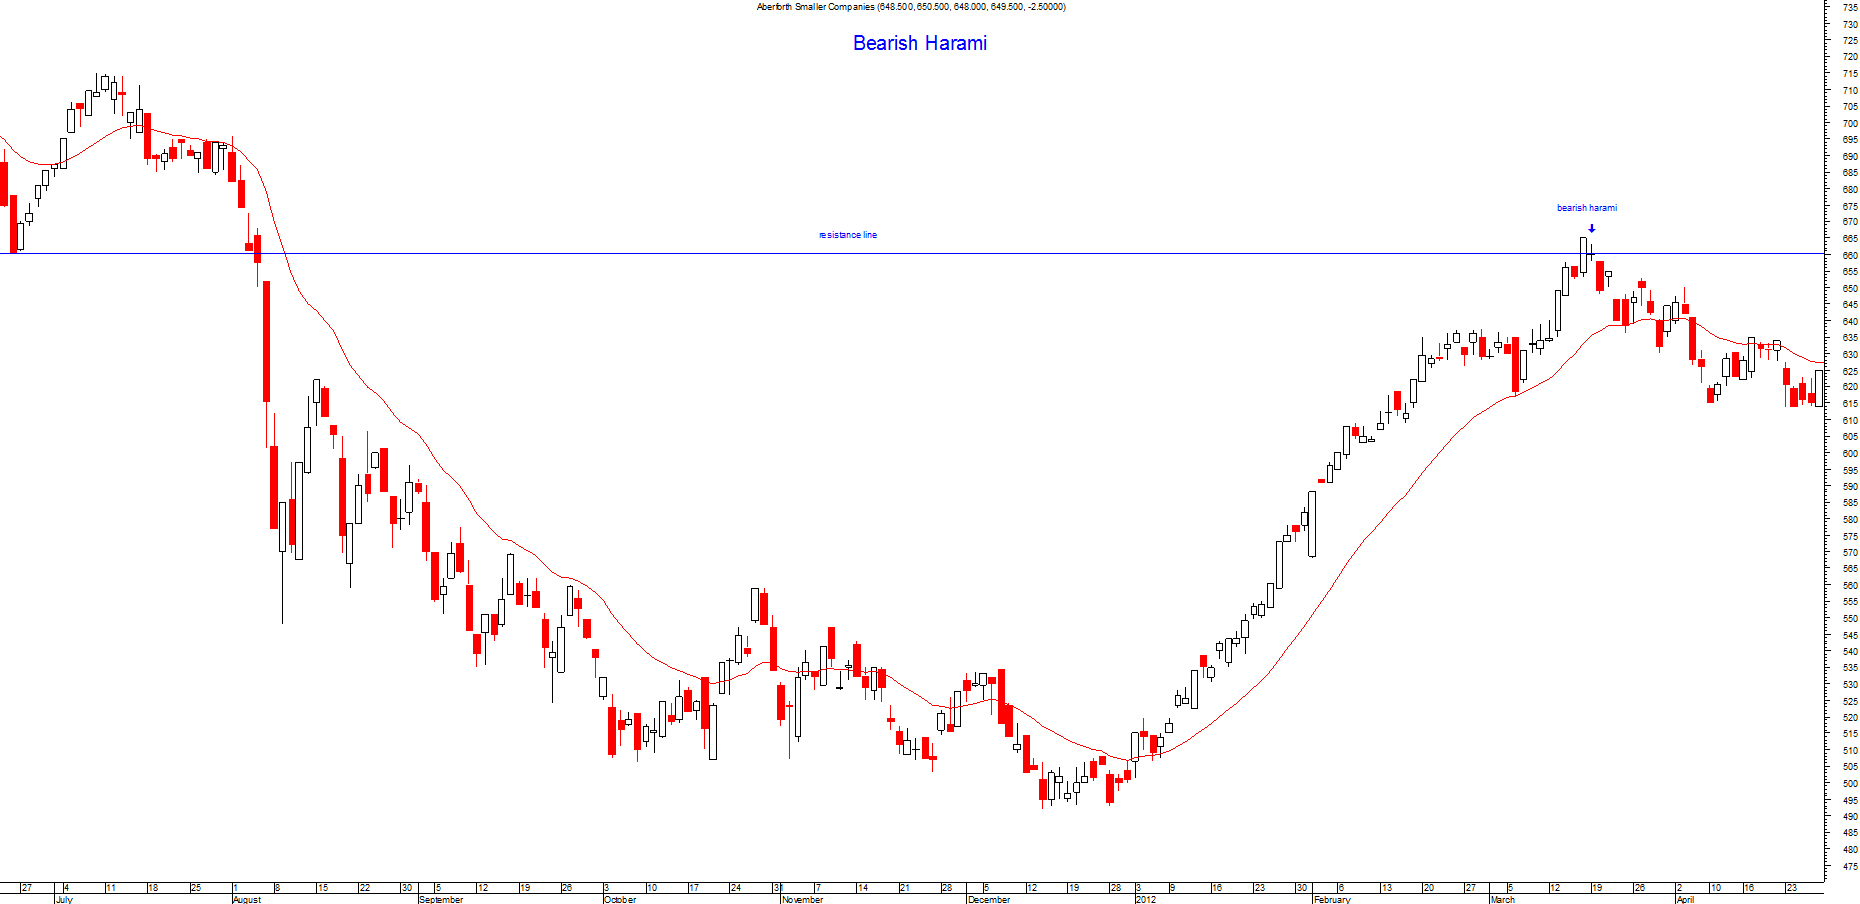
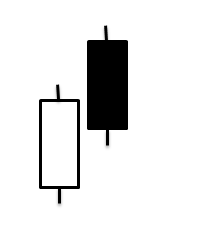
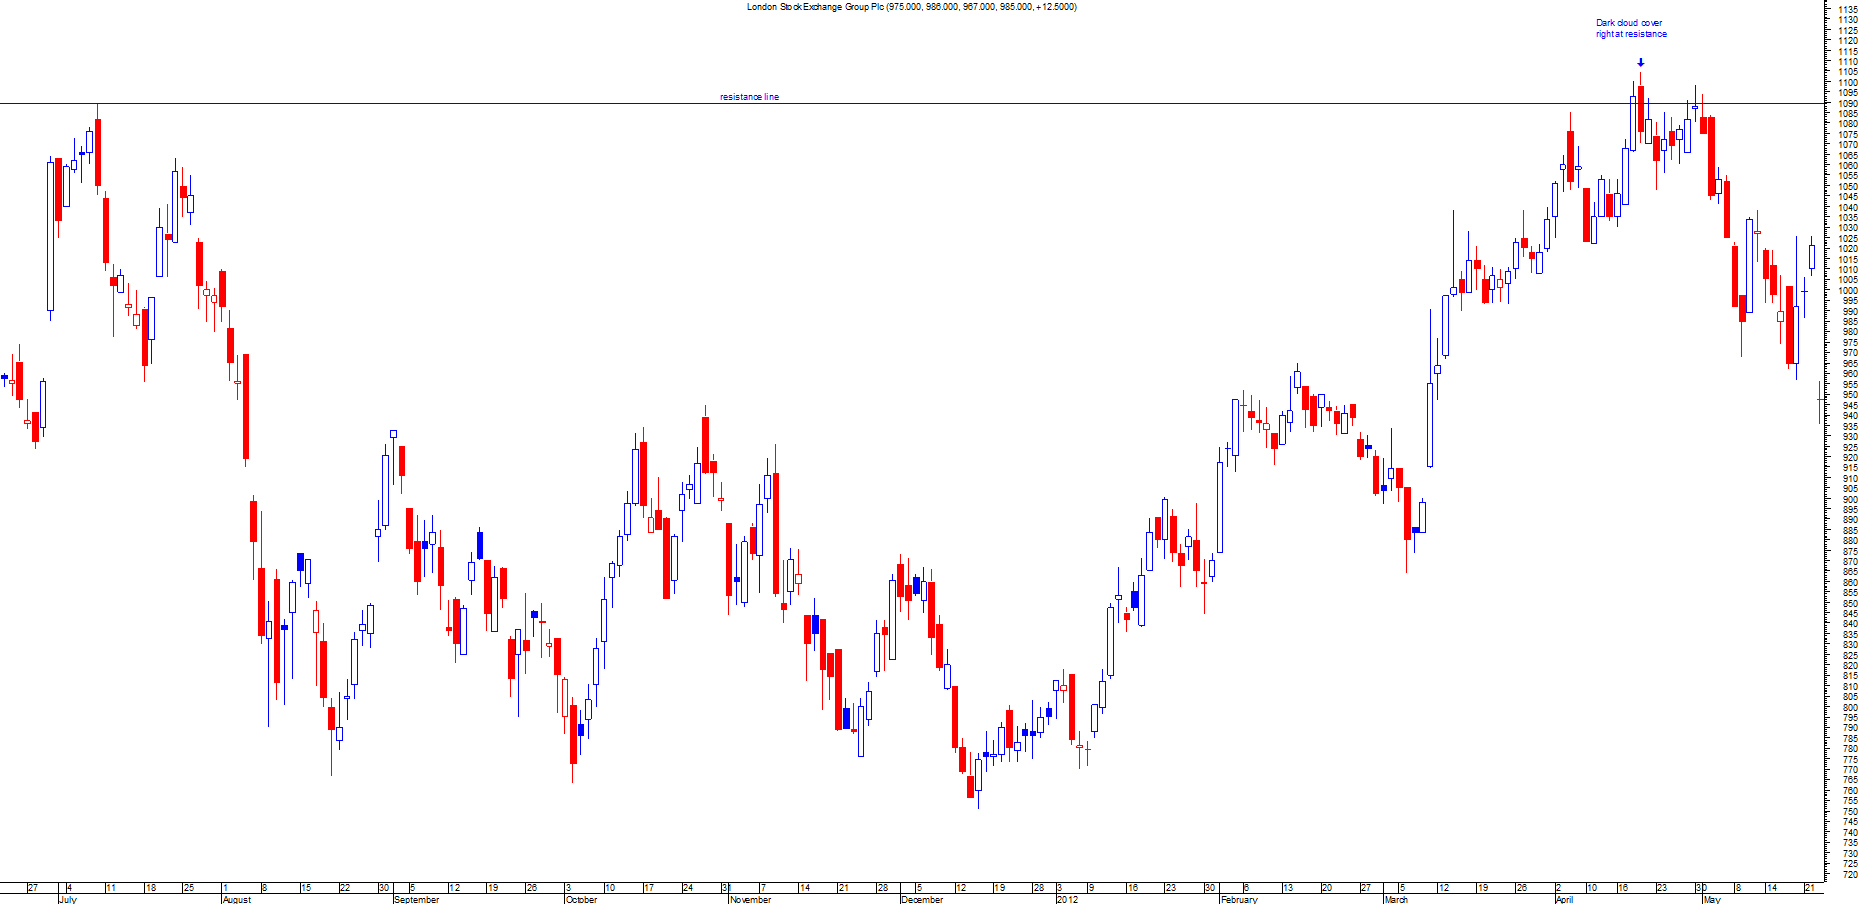
This pattern consists of two candles representing two consecutive days. Usually found at the top of an up trend, it starts bullish with a large white candle on the first day however on the second day the price gaps down.
This is the first sign that the bears have started to take some control back and indicates a reversal of the trend.
The bears maintaining their control and closing on a low enforces this sentiment further.
Please click on picture above to get a larger picture
Most candlestick patterns should appear close to previous resistance or support levels depending on what type it is. You should only trade a candlestick pattern if it's near these levels.
Don't trade using these patterns if it's not at the top or bottom of a trend. These patterns appear a great deal so you have to make certain you only trade at the right level.
This is very important as you will end up over trading them and you will end up losing more money than you imagined.
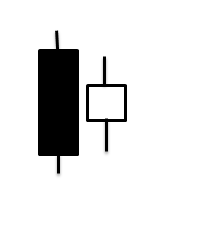
This pattern consists of two candles representing two consecutive days. Usually found at the end of a down trend, it starts bearish with a large black candle on the first day however on the second day the price gaps up and finishes inside the first candle(contained).
This is the first sign that the bulls have started to take some control back and indicates a reversal of the trend.
This sentiment is enforced further by the bulls maintaining their control and closing on a high.
Please click on picture above to get a larger picture
Most candlestick patterns should appear close to previous resistance or support levels depending on what type it is. You should only trade a candlestick pattern if it's near these levels.
Don't trade using these patterns if it's not at the top or bottom of a trend. These patterns appear a great deal so you have to make certain you only trade at the right level.
This is very important as you will end up over trading them and you will end up losing more money than you imagined.
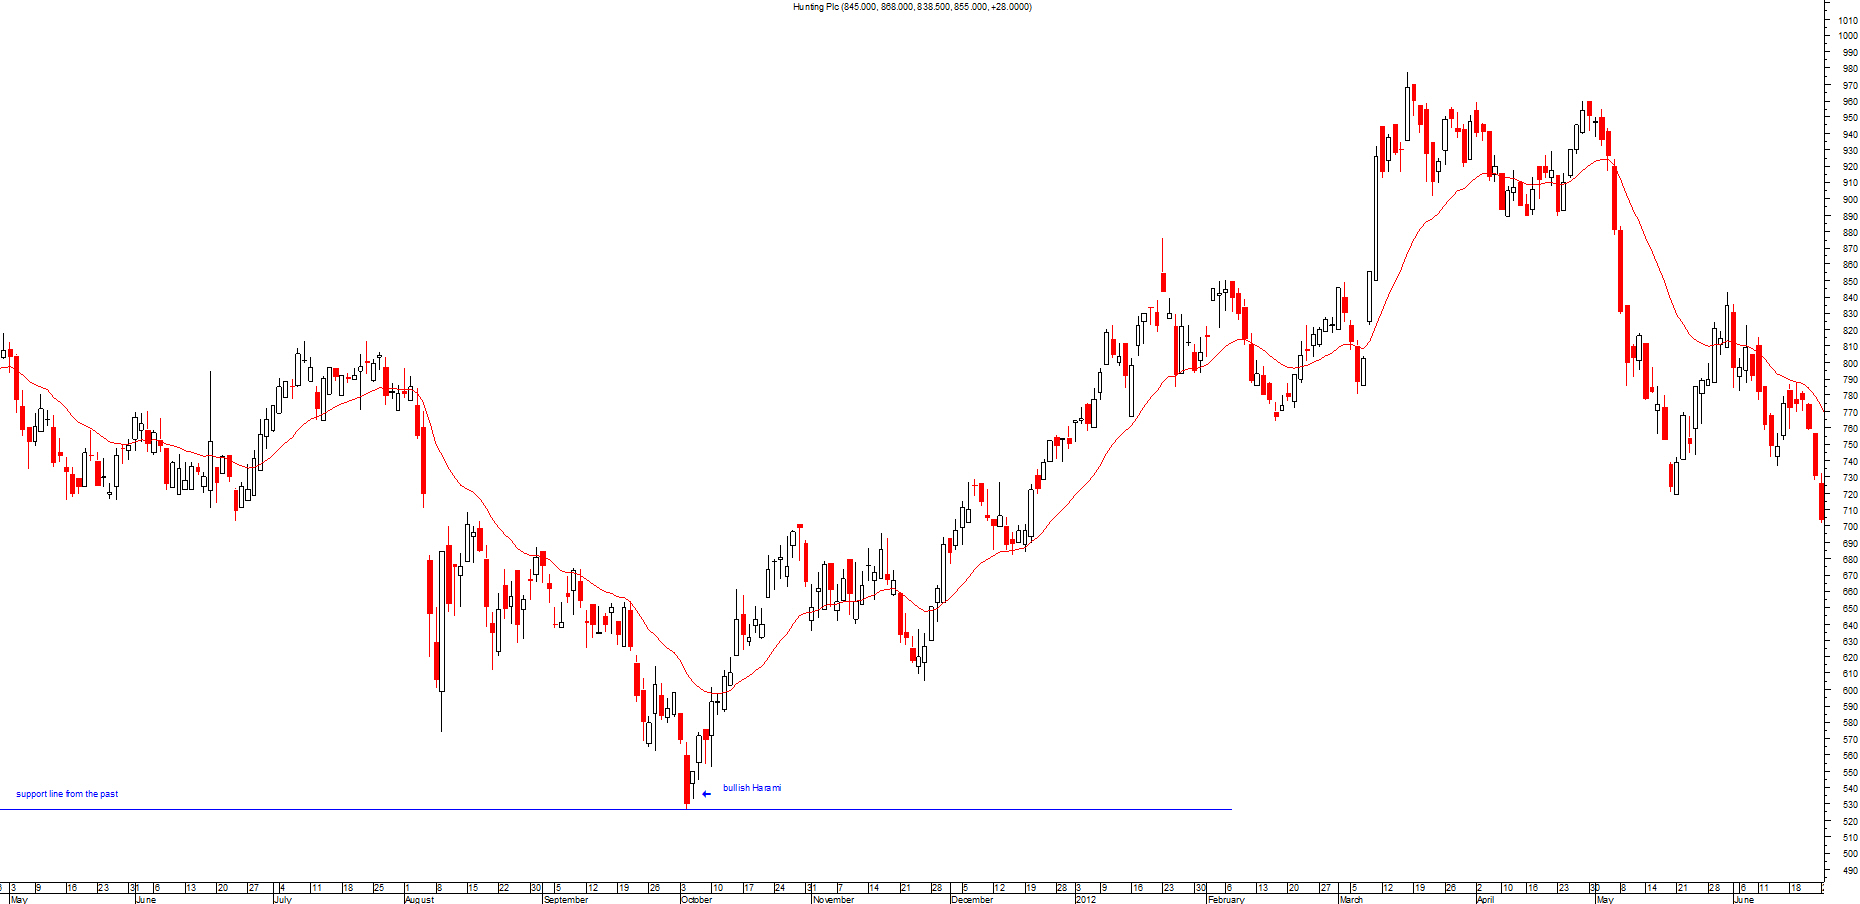
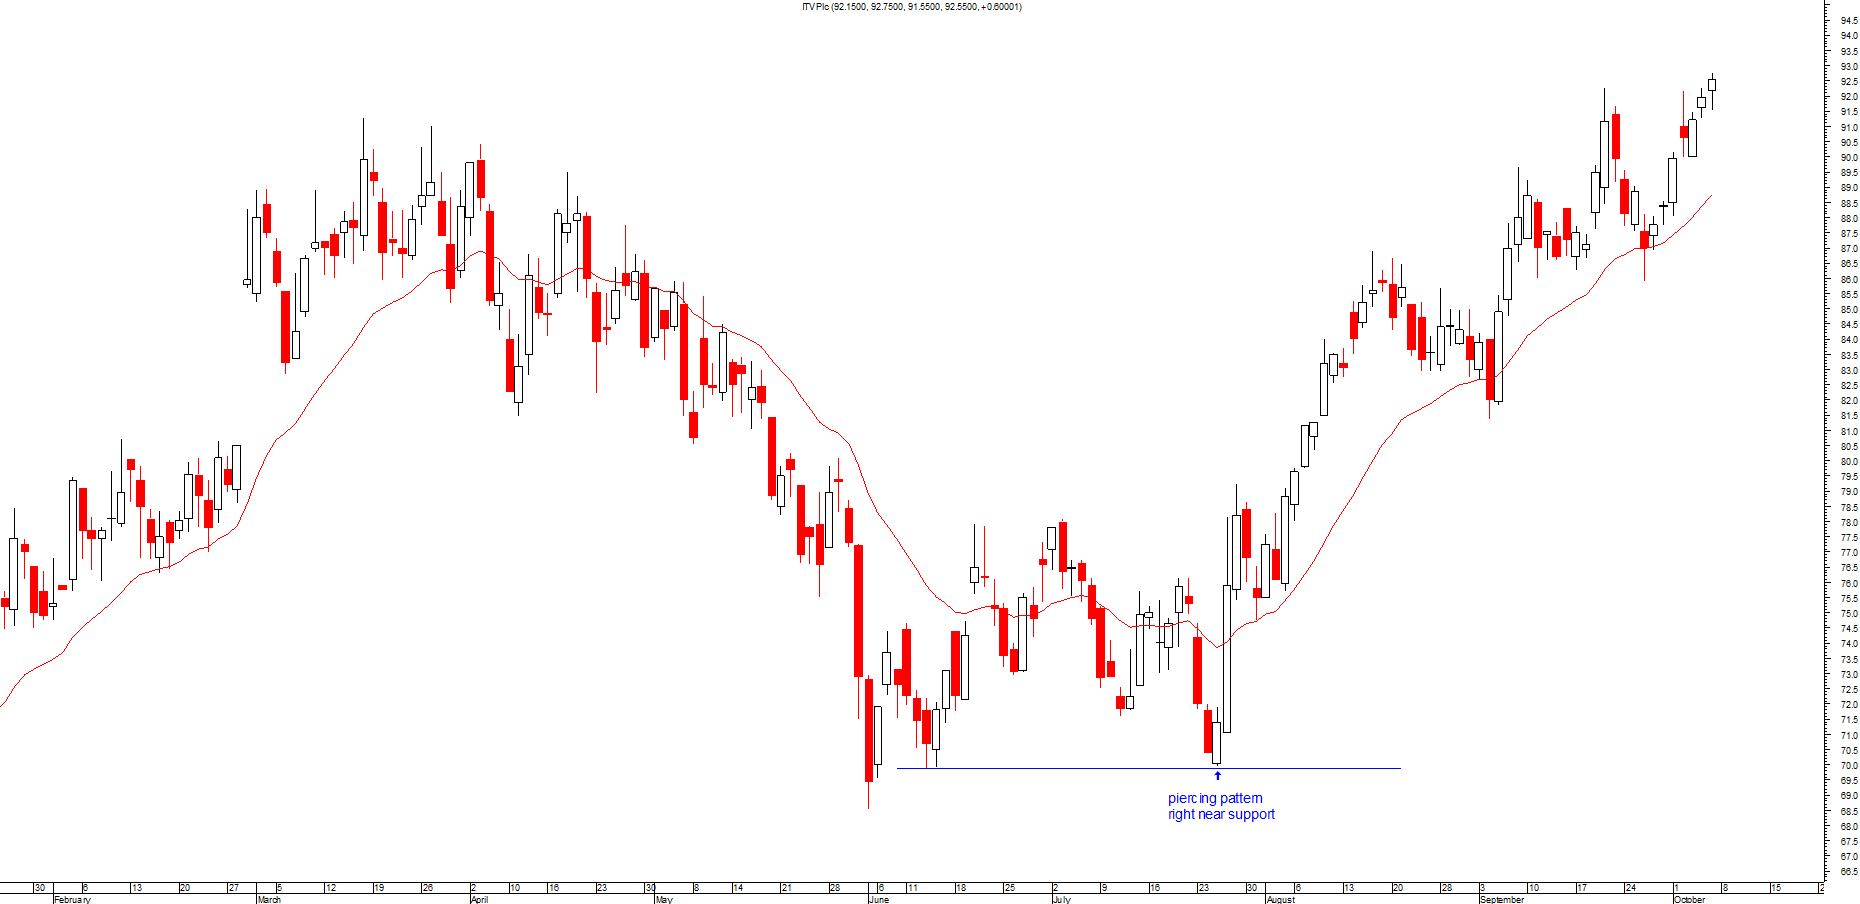
This pattern consists of two candles representing two consecutive days. Usually found at the end of a down trend, it starts bearish with a black candle and on the second day the candle reaches a new low but things soon change as suggested by the name.
The price does not stay at the low but instead the bulls take control back and reverse the trend all the way back up, about half way up the first candle so that the price finishes on a high.
If on the third day it finishes on a high then that would confirm this reversal further.
Please click on picture above to get a larger picture
Most candlestick patterns should appear close to previous resistance or support levels depending on what type it is. You should only trade a candlestick pattern if it's near these levels.
Don't trade using these patterns if it's not at the top or bottom of a trend. These patterns appear a great deal so you have to make certain you only trade at the right level.
This is very important as you will end up over trading them and you will end up losing more money than you imagined.
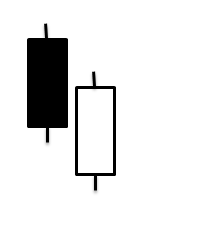
This pattern consists of two candles representing two consecutive days. Usually found at the top of an up trend, it starts bullish with a white candle and on the second day the candle reaches a new high but things soon change as suggested by the name.
The price does not stay at the high but instead the bears take control and reverse the trend all the way back so that the price finishes on a low and midway down the first candle.
If on the third day it finishes on a low then that would confirm this reversal further.
Please click on picture above to get a larger picture
Most candlestick patterns should appear close to previous resistance or support levels depending on what type it is. You should only trade a candlestick pattern if it's near these levels.
Don't trade using these patterns if it's not at the top or bottom of a trend. These patterns appear a great deal so you have to make certain you only trade at the right level.
This is very important as you will end up over trading them and you will end up losing more money than you imagined.