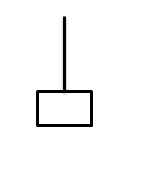
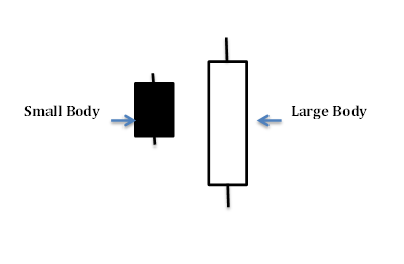
This pattern is the opposite of the hammer pattern, as the name suggests it looks like a upside down hammer consisting of a small body with a long tail or shadow above the body but no or little shadow below the body.
If this pattern comes at the end of a down trend it could signify reversal in the trend. This is because the bulls have pushed the price higher but although the bears have pushed the price to close lower they could not push the price to a further low than the opening price.
This means the bulls have more control of the market. However, to confirm this bullish pattern further you would need the next day also to finish on a high.
Please click on picture above to get a larger picture
Most candlestick patterns should appear close to previous resistance or support levels depending on what type it is. You should only trade a candlestick pattern if it's near these levels.
Don't trade using these patterns if it's not at the top or bottom of a trend. These patterns appear a great deal so you have to make certain you only trade at the right level.
This is very important as you will end up over trading them and you will end up losing more money than you imagined.
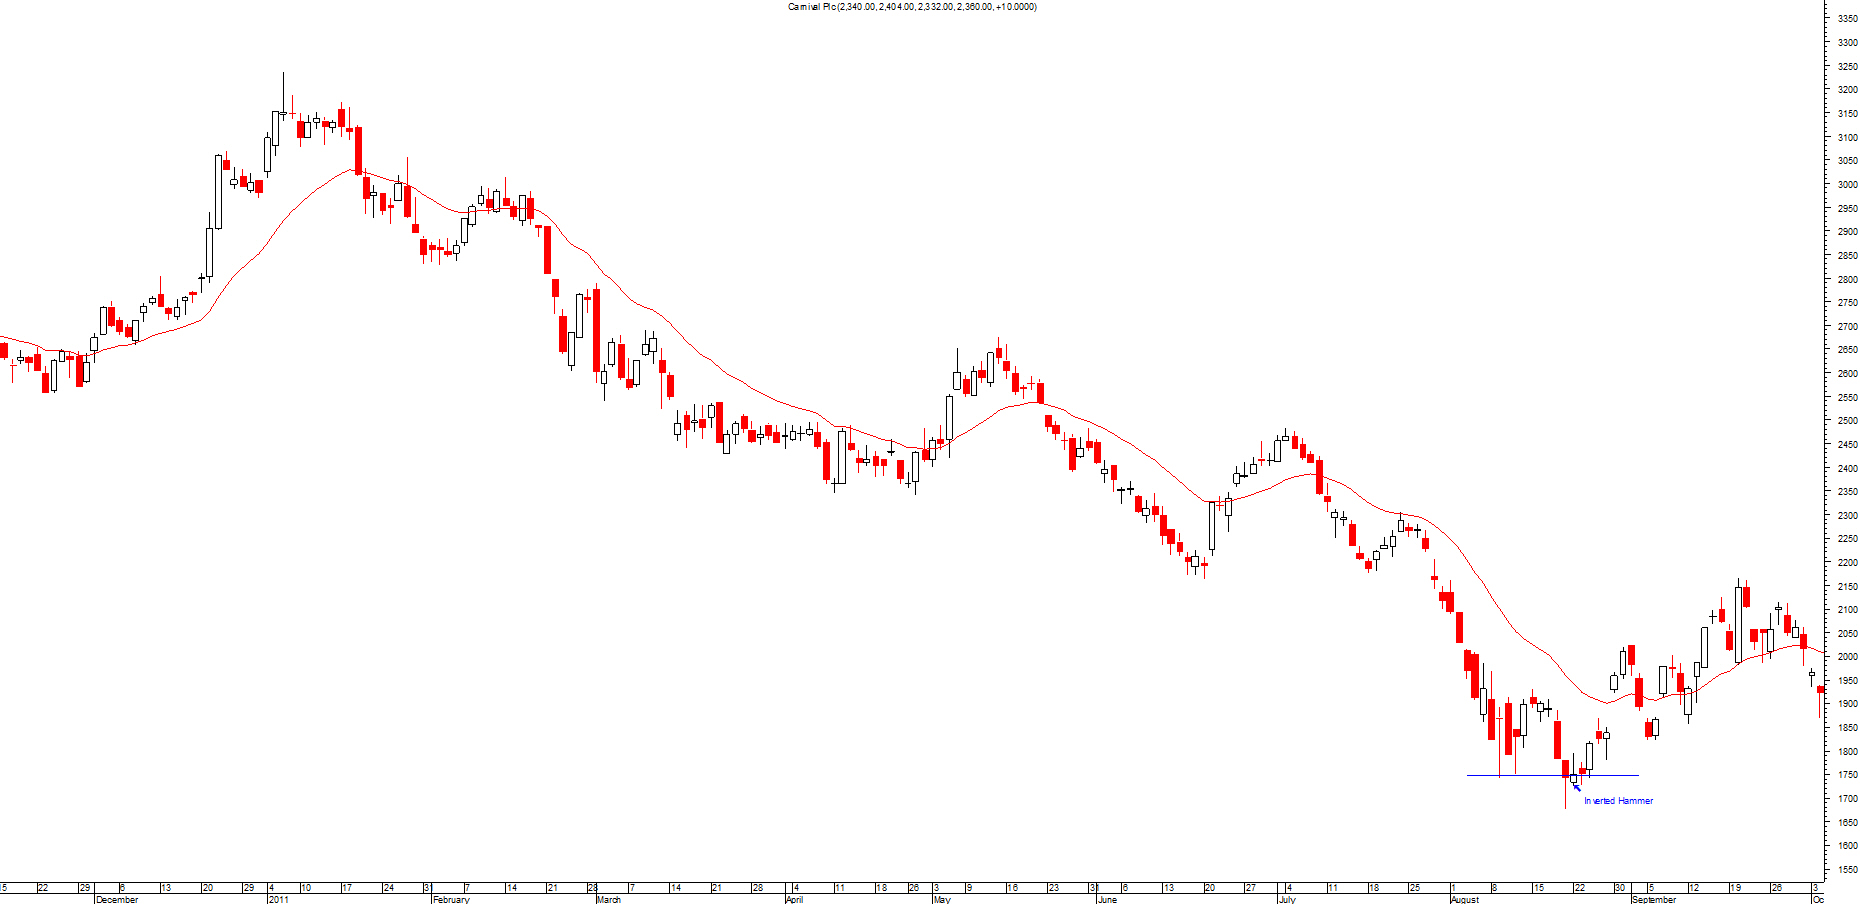
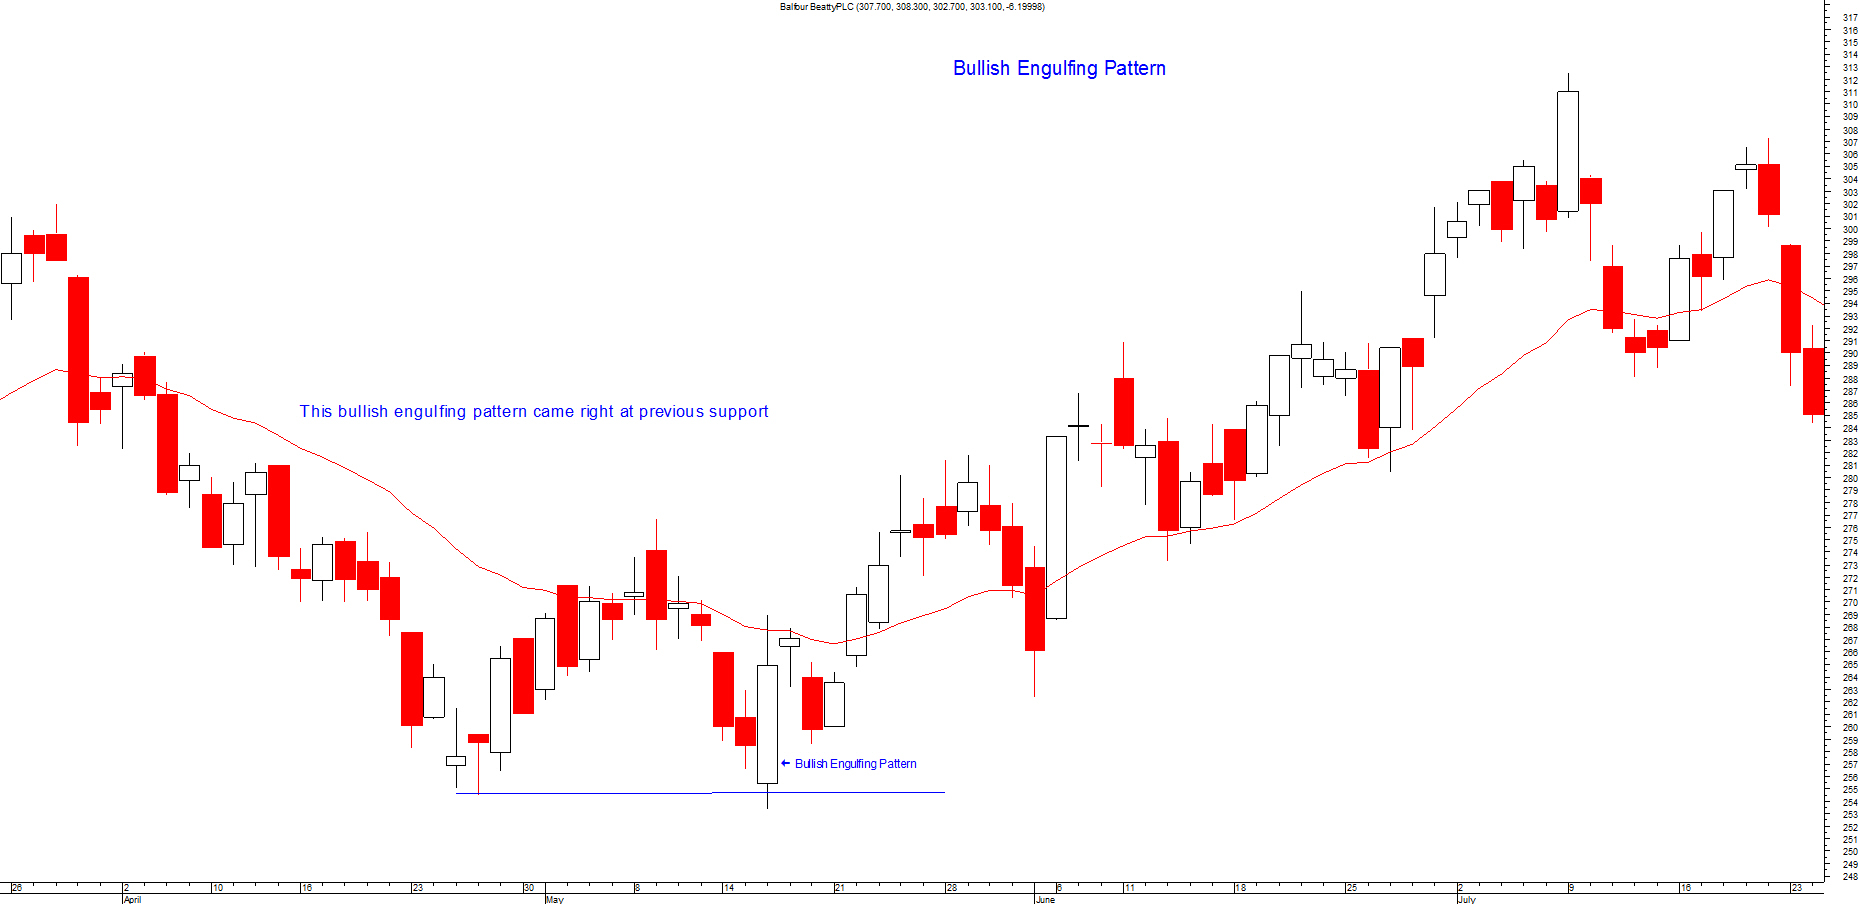
This pattern is the opposite of the bearish engulfing pattern, in this case the pattern consists of a small black candle followed by a large white candle; the white candle has opened lower but has closed higher than the previous day thus is engulfing the small black candle.
The significance of this pattern is that it usually comes after a downtrend and therefore indicates a major reversal in the markets.
It signifies a bullish market where bulls have won out and where the selling has stopped therefore this pattern could be used as a signal to trade long.
Please click on picture above to get a larger picture
Most candlestick patterns should appear close to previous resistance or support levels depending on what type it is. You should only trade a candlestick pattern if it's near these levels.
Don't trade using these patterns if it's not at the top or bottom of a trend. These patterns appear a great deal so you have to make certain you only trade at the right level.
This is very important as you will end up over trading them and you will end up losing more money than you imagined.
The Doji pattern is a strong indicator, it is created when the opening of the price is the same as the close of the price on a given day therefore it does not consist of a candle body.
The pattern can occur at the bottom of a downtrend or at the top of an uptrend. It is a strong indicator because it signifies that no one in the market has control, the bulls or bears are in the same position, which means that there is great uncertainty and indecision.
There are different types of doji patterns; one of them is called the long-legged doji. This pattern has a greater upper and lower shadow, which emphasis the indecision of traders.
Due to this uncertainty, it is thought that if the doji appears at the top of an uptrend then it could signal a bearish reversal and if it appears at the bottom of a downtrend it could signal a bullish reversal.


Please click on picture above to get a larger picture
Most candlestick patterns should appear close to previous resistance or support levels depending on what type it is. You should only trade a candlestick pattern if it's near these levels.
Don't trade using these patterns if it's not at the top or bottom of a trend. These patterns appear a great deal so you have to make certain you only trade at the right level.
This is very important as you will end up over trading them and you will end up losing more money than you imagined.
This pattern as the name suggests looks like a hammer with a small body with a long tail or shadow below the body but no or little shadow above the body. Although the candle has a substantial low, by the end of the day it moves to a high.
This pattern usually occurs at the end of a downtrend and signals a reversal in the trend. It shows that the bulls have fought the low and managed to push the buying to a high. To confirm this bullish pattern further you would need the next day also to finish on a high.


Please click on picture above to get a larger picture
Most candlestick patterns should appear close to previous resistance or support levels depending on what type it is. You should only trade a candlestick pattern if it's near these levels.
Don't trade using these patterns if it's not at the top or bottom of a trend. These patterns appear a great deal so you have to make certain you only trade at the right level.
This is very important as you will end up over trading them and you will end up losing more money than you imagined.
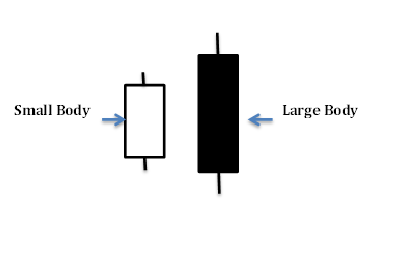
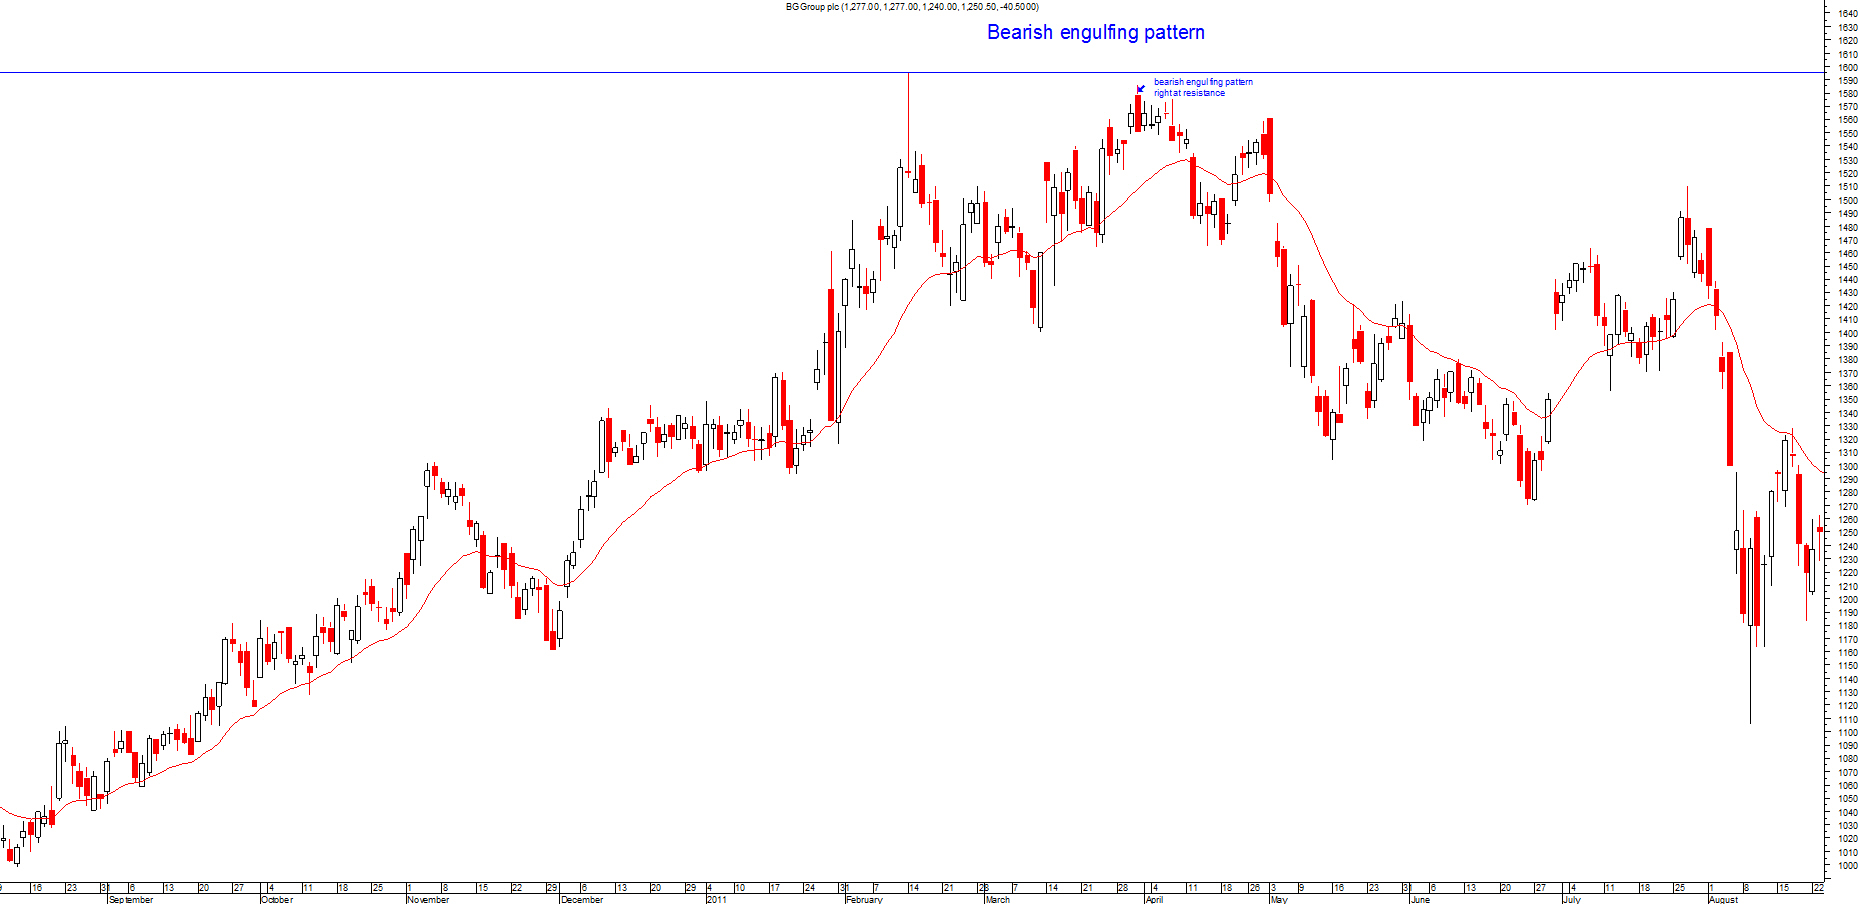
This pattern consists of a small white candle followed by a large black candle; the large black candle has opened higher but has closed lower than the previous day thus is engulfing the small white candle.
The significance of this pattern is that it usually comes after an up trend and therefore indicates a major reversal in the markets.
It signifies a bearish market where bears have won out and that the buying has stopped therefore this pattern could be used as a signal to short trades.
Please click on picture above to get a larger picture
Most candlestick patterns should appear close to previous resistance or support levels depending on what type it is. You should only trade a candlestick pattern if it's near these levels.
Don't trade using these patterns if it's not at the top or bottom of a trend. These patterns appear a great deal so you have to make certain you only trade at the right level.
This is very important as you will end up over trading them and you will end up losing more money than you imagined.
Technical Analysis has been used for centuries in Japan; it all originated from trading of rice and this is where the Japanese candlesticks method was born.
Japanese candlesticks came to the western world much later and were introduced by Steven Nixon in his book "Japanese's Candlesticks Charting Techniques". Japanese candlesticks are a very popular charting method used in trading all over the world.
A Japanese candlestick depicts the price movement of a share including the opening and closing prices as well as the high and low price of a share on any given day.
The reason they are so popular is because they illustrate a great deal of information, it is clear to see patterns emerging and therefore they are fairly easy to use and interpret.
A great advantage they possess is they also provide visual signals and cues to the market sentiment and what investors are thinking, which is priceless information to have in trading.
Based on this information investors can decide what actions they must take to make the most out of the situation and ultimately be successful in their trade.
The filled part of the candlestick is called the body, the line above the candlestick is the high and the line below the body is the low. These lines are known as shadows, tails or wicks.
When the close of the day is higher than the open then the candlestick is white, which signals that it has been a bullish day.

When the close of the day is lower than the open then the candlestick is black, which signals that it has been a bearish day.

There are 3 types of triangles:
• Symmetrical Triangle
• Ascending Triangle
• Descending Triangle
These are all continuation patterns so are best used in the direction of the trend.
This pattern has a flat bottom line and falling trend line from above. This should breakout in the direction of the previous trend.
This should be used in downtrends as descending triangles are bearish patterns, volume should be higher on the flat bottom line breakout. Once broken this line then becomes resistance.
Please click on chart below for larger image

Its best to use the widest point of the triangle as a measuring tool. If for example at the widest point it was 50 pips long then the target is going to be 50 pips from the breakout point.
Triangles can take from 1 month to 3 months to form and any smaller than 2 weeks could be a pennant or flag.