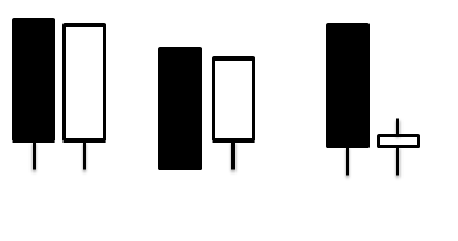
A tweezer bottom is two candles in a row with lows at almost exactly the same price, forming after a fall. The market tested the same floor twice and buyers held it both times. It can be an early sign that a downtrend is losing its grip.
What a tweezer bottom looks like
- Candle one: usually a bearish candle that continues the decline.
- Candle two: usually a bullish candle whose low matches the first candle's low, or comes very close.
The two lows line up like the tips of tweezers. Long lower wicks on either candle add to the signal, because they show buyers stepping in hard below the open.
What it tells you
Sellers push the price down to a level, buyers defend it, and the next day sellers try again and fail at the same price. A floor has appeared. The second candle closing higher shows buyers starting to take charge.
How to trade a tweezer bottom
- Confirmation: wait for the next candle to close above the high of the second candle.
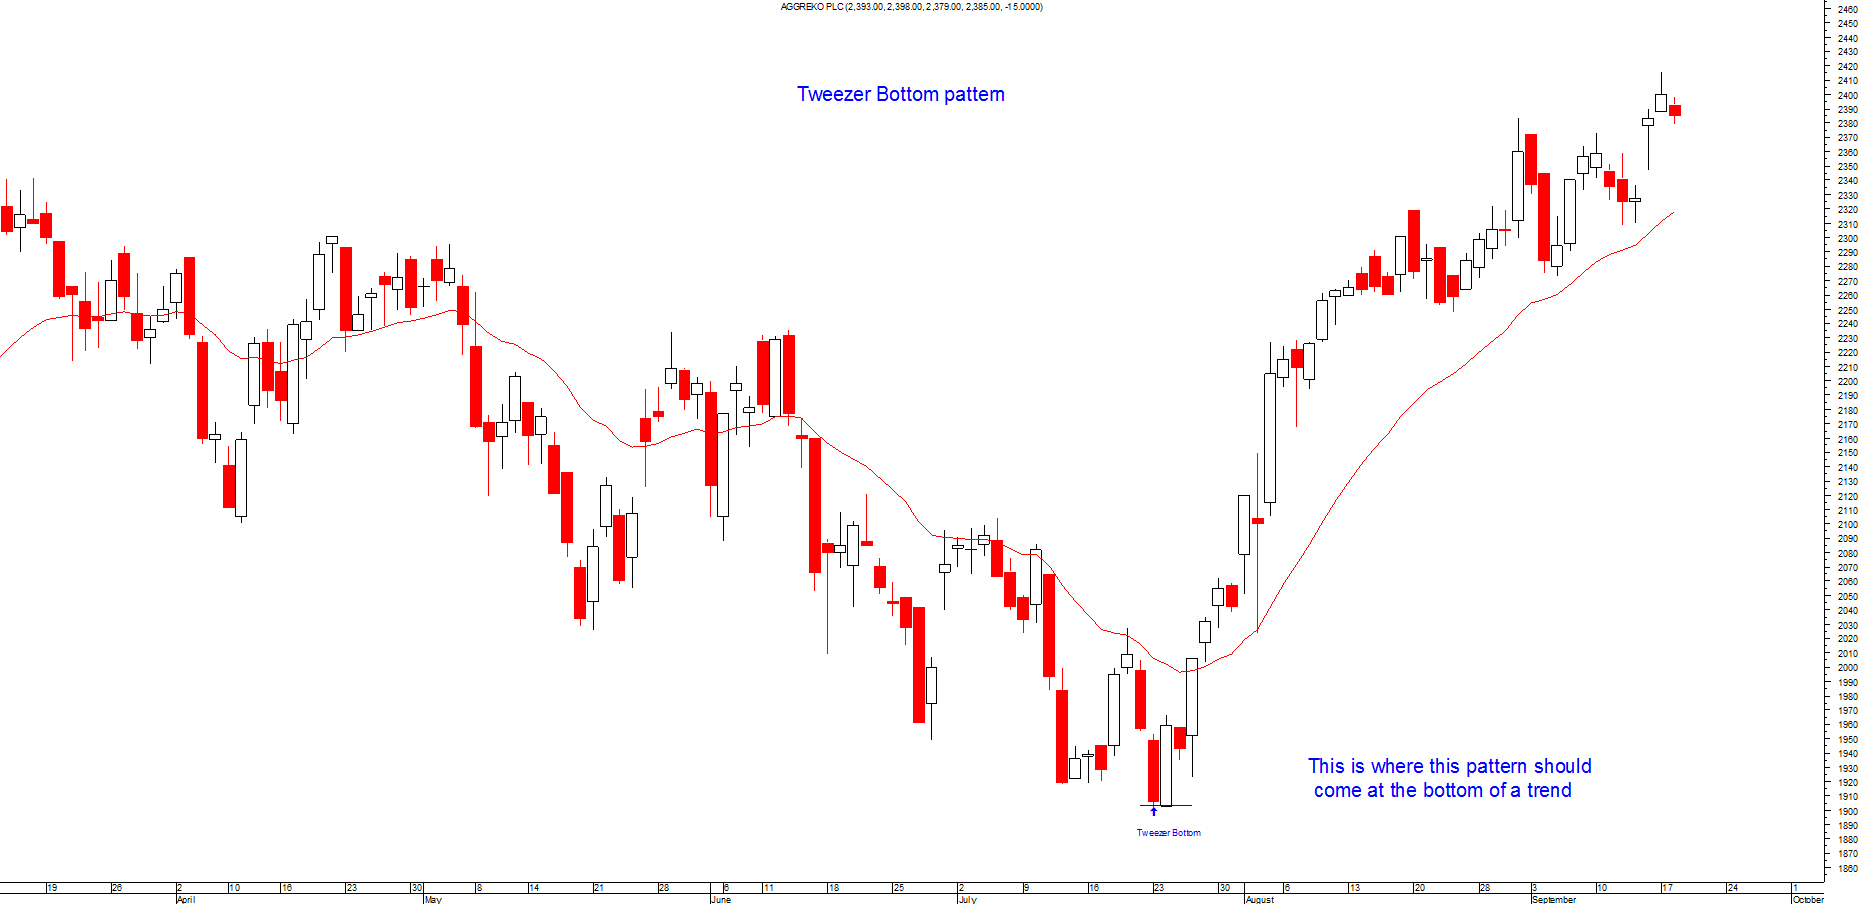
- Location: look for it at known support, a rising trend line, or a level where the price turned before.
- Stop: just below the matching lows.
- Target: the nearest resistance, or a fixed risk-reward ratio such as 2 to 1.
A candle pattern on its own is weak evidence. It matters most when it forms at a level that already matters, such as support, resistance, a trend line or a moving average, and when the next candle confirms it.
Mistakes to avoid
- Buying matching lows in the middle of a strong downtrend without any support nearby.
- Skipping confirmation. Many tweezer bottoms are followed by another leg lower.
- Setting the stop too close. Give the trade room below the matching lows.
Related guides
- Tweezer top
- Bullish harami
- Hammer and hanging man
- Essential candlestick patterns
- Support and resistance zones
This guide is for education only and is not financial advice. Trading carries risk; you can lose more than you expect.