A bar chart plots the opening price and closing price and intraday peaks and troughs. All this from a simple vertical line termed a bar.
The day's high and low is plotted using the height of the bar, the price the market opened is drawn across the left of the bar with a horizontal dash, the price that the market closed is drawn with a horizontal dash drawn across the right of the bar.
 All time frames can be plotted this way and basically the bar holds the movement of the whole day visually.
• You can see the whole picture on a bar chart. It has all the data for the days move in a visual format.
• Easy to spot extremes and important levels.
• Western technical can be applied. i.e. Gaps, islands, inside bars, etc, etc.
• Drawing trend lines can be accurate, as you will use the extremes of the day by joining them together (from key bottoms).
• Easier to apply stop losses, as you would use the bottom of the bar as a guide, so will place the stops below the extremes.
• It's not easy for beginners to get to grip with bar charts as there is too much information available.
• Will take some time to gain experience using them.
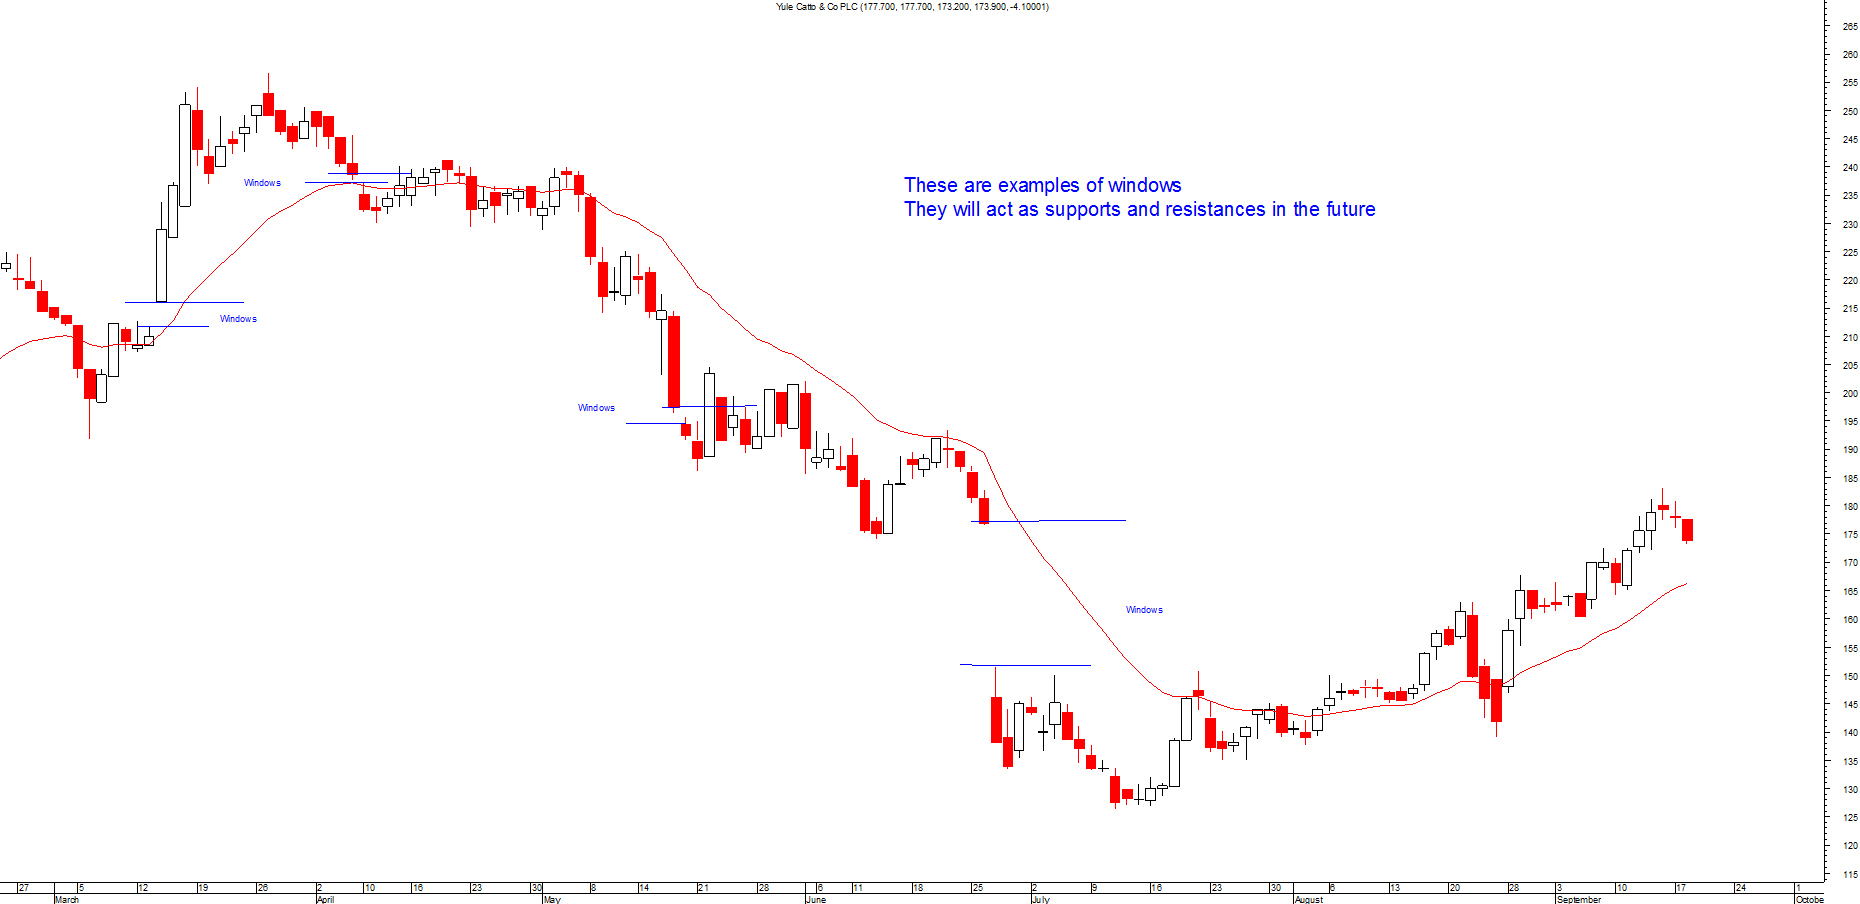
Chart is provided by MetaStock and is an example of a bar chart

This article looks at trading systems and hopefully it will give you a start to develop your own trading systems.
There are hundreds of systems out there.
• Inside Bar Trading System
• 1 Hour Trading System
• 20 day Trading System
• 3 Ducks Trading System
The system you use all depends on what type of trader you are, if you are more of a day trader the 20 day trading system may be too slow for you.
Like all systems, you should only really trade one system at any one time. If you trade more than one system then chances are you will end up over trading.
This in turn will mean your money management will be effected and this may result in you ending the system to early without giving it time to work properly.
The idea being that if you had a few bad trades then you may end up allowing emotion to come into your trading, which is a big mistake in trading.
So the emotions will over take your logic and you may end up losing before the system has a real chance to work.
If you are using a system make sure you test the system out thoroughly and stick to the rules.
Don't increase the risks after a few good trades but stick to your money management rules.
There are quite a few different types of charts out there.
The first set of charts are the most common ones whereas the latter are not so common:
• Bar charts
• Japanese candlestick charts
• Point and figure Charts
• Ichimoku charts
There are also more charts types out there like:
• Candlevolume
• Equivolume
• Kagi
• Renko
• Three line break
When using technical on charts the price is plotted on the vertical axis and the time scale is plotted on the horizontal axis.
This is common on all the charts apart from point and figure charts which the time (vertical axis) is determined by the price fluctuations of 0s and xs.
This will be discussed later in more detail. Most of the time the price and time is scaled Arithmetically.
There are many candlestick pattern that you can use in your trading, the reason they are so popular is because they illustrate a great deal of information.
They are clear to see patterns emerging and therefore they are fairly easy to use and interpret to what they represent or indicate. Here is a recap of the most common patterns used:
|
Name |
No. of candles |
Indicator |
|
Bearish Engulfing |
2 |
Bearish, Reversal |
|
Bullish Engulfing |
2 |
Bullish, Reversal |
|
Hammer |
1 |
Bullish, Reversal |
|
Inverted Hammer |
1 |
Bullish, Reversal |
|
Hanging Man |
1 |
Bearish, Reversal |
|
Doji |
1 |
Uncertainty, Indecision |
|
Gravestone Doji |
1 |
Bearish |
|
Morning Star |
3 |
Bullish, Reversal |
|
Evening Star |
3 |
Bearish, Reversal |
|
Shooting Star |
2 |
Bearish, Reversal |
|
Three Black Crows |
3 |
Bearish, Reversal |
|
Three White Soldiers |
3 |
Bullish, Reversal |
|
Dark Cloud Cover |
2 |
Bearish, Reversal |
|
Piercing line |
2 |
Bullish, Reversal |
|
Bullish Harami |
2 |
Bullish, Reversal |
|
Bearish Harami |
2 |
Bearish, Reversal |
|
Tweezer Top |
2 |
Bearish, Reversal |
|
Tweezer Bottom |
2 |
Bullish, Reversal |
|
Spinning Top |
2 |
Uncertainty, Indecision |
|
Maruboza white |
1 |
Bullish |
|
Maruboza Black |
1 |
Bearish |
|
Gap Up |
2 |
Bullish |
|
Gap Down |
2 |
Bearish |
This pattern is considered as a key method in candlestick charting because it provides a great deal of clues and information about the sentiment in the market.
The pattern consists of two different formations: Gap Ups and Gap Downs, we will look at both in turn.
This pattern consists of two candles representing two consecutive days, it is created when the opening price of the candle on day 2 is higher than the closing price of the candle on day 1 thus literally creating a gap of white space between the two candles.
This pattern indicates that the sentiment is positive and that the bulls have taken control by starting at a high therefore this pattern would indicate a bullish signal.
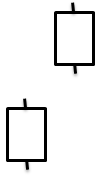
This pattern consists of two candles representing two consecutive days, it is created when the opening price of the candle on day 2 is lower than the closing price of the candle on day 1 thus literally creating a gap of white space between the two candles.
This pattern indicates that the sentiment is negative and that the bears have taken control by starting at a low therefore this pattern would indicate a bearish signal.

Please click on picture above to get a larger picture
Most candlestick patterns should appear close to previous resistance or support levels depending on what type it is. You should only trade a candlestick pattern if it's near these levels.
Don't trade using these patterns if it's not at the top or bottom of a trend. These patterns appear a great deal so you have to make certain you only trade at the right level.
This is very important as you will end up over trading them and you will end up losing more money than you imagined.
This pattern consists of only one candle, what is significant about this pattern however is that the candle has no tail below or above the body.
It is created when the opening price is the same as the high price and the closing price is the same as the low price of the day.
This pattern reflects the fact that the bears are in a strong position; they have taken control of the market to such an extent that they have been able to sustain control all day, which has resulted in the price equating to the open and close price.
This therefore would indicate a very bearish signal.


Please click on picture above to get a larger picture
Most candlestick patterns should appear close to previous resistance or support levels depending on what type it is. You should only trade a candlestick pattern if it's near these levels.
Don't trade using these patterns if it's not at the top or bottom of a trend. These patterns appear a great deal so you have to make certain you only trade at the right level.
This is very important as you will end up over trading them and you will end up losing more money than you imagined.
This pattern consists of only one candle, what is significant about this pattern however is that the candle has no tail below or above the body.
It is created when the opening price is the same as the low price and the closing price is the same as the high price of the day.
This pattern reflects the fact that the bulls are in a strong position; they have taken control of the market to such an extent that they have been able to sustain control all day, which has resulted in the price equating to the open and close price.
This therefore would indicate a very bullish signal.


Please click on picture above to get a larger picture
Most candlestick patterns should appear close to previous resistance or support levels depending on what type it is. You should only trade a candlestick pattern if it's near these levels.
Don't trade using these patterns if it's not at the top or bottom of a trend. These patterns appear a great deal so you have to make certain you only trade at the right level.
This is very important as you will end up over trading them and you will end up losing more money than you imagined.