There are 3 types of triangles:
• Symmetrical triangle
• Ascending Triangle
• Descending triangle
These are all continuation patterns so are best used in the direction of the trend.
This has 2 converging trend lines that meet at the apex. The upper trend lines that is descending and the lower trend line that is ascending these meet at the apex.
The breakout favours the direction of the trend prior to the symmetrical triangle formation, For example:
If the trend was down then there is more of a chance of a downward breakout. Being a symmetrical triangle, you can trade the break in both directions but best to trade in the directions of the trend.
Most breakouts happen around the two thirds to three quarters of the length of the triangle. If the price moves past the apex of the triangle then it becomes void thus this actually has a time limit attached.
Please click on chart below for larger image
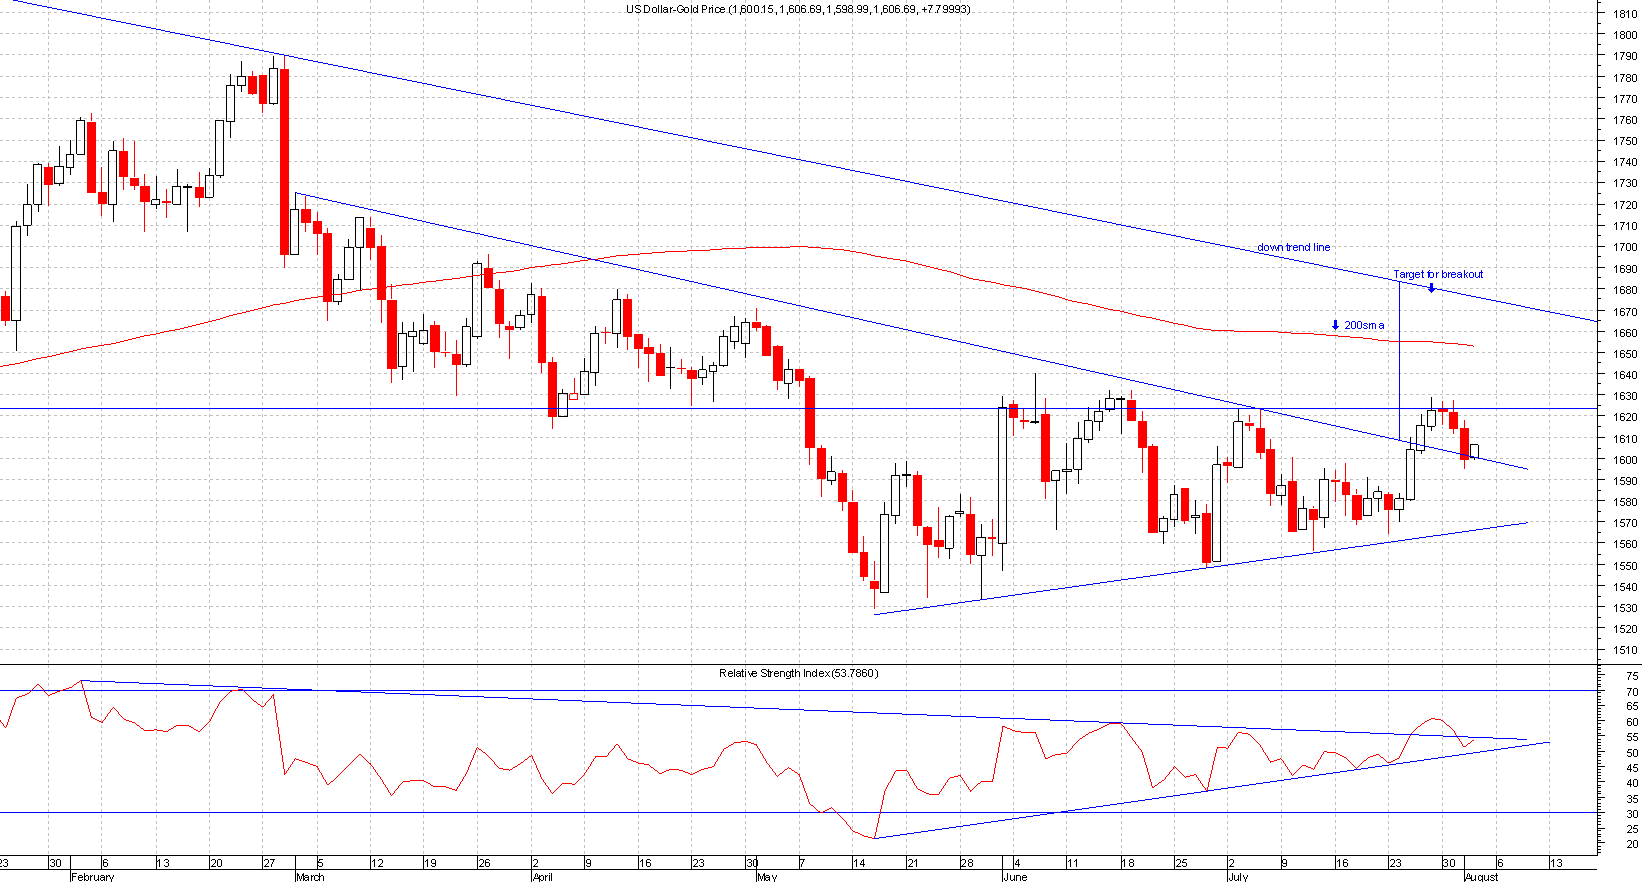
The signal comes once the price finishes the day above or below the trend line, the end of day price counts the most.
Once a breakout comes the trend line then becomes support or resistance depending on direction of breakout.
Its also quite common for a re-test to occur and volumes fade away as the triangle narrows. Volume should pick up once a penetrations occurs.
For the target you should use the widest point of the triangle as a measuring tool. If for example at the widest point it was 50 pips long then the target is going to be 50 pips from the breakout point.
Note: Triangle can take from 1 month to 3 months to form and any smaller than 2 weeks could be a pennant or flag.
There are 3 types of triangles:
• Symmetrical triangle
• Ascending Triangle
• Descending triangle
These are all continuation patterns so are best used in the direction of the trend.
This triangle has a flat trend line on the top and a rising trend line from below.
Ascending triangles are bullish and implies a break higher. This should breakout in the direction of the previous trend.
Volume should be higher on the breakout and once a breakout occurs then that level where it broke out from will now be support.
Please click on chart below for larger image

For the target use the widest point of the triangle as a measuring tool. If for example at the widest point it was 50 pips long then the target is going to be 50 pips from the breakout point.
Note: Triangles can take from 1 month to 3 months to form and any smaller than 2 weeks could be a pennant or flag formation.
Major uptrends can last years and within the uptrend you can have intermediate counter trends.
Even though the major trend is up you may have downtrends that last a few months within the bigger trends. These are what identify the bigger trends in the future.
Please click on chart below for larger image
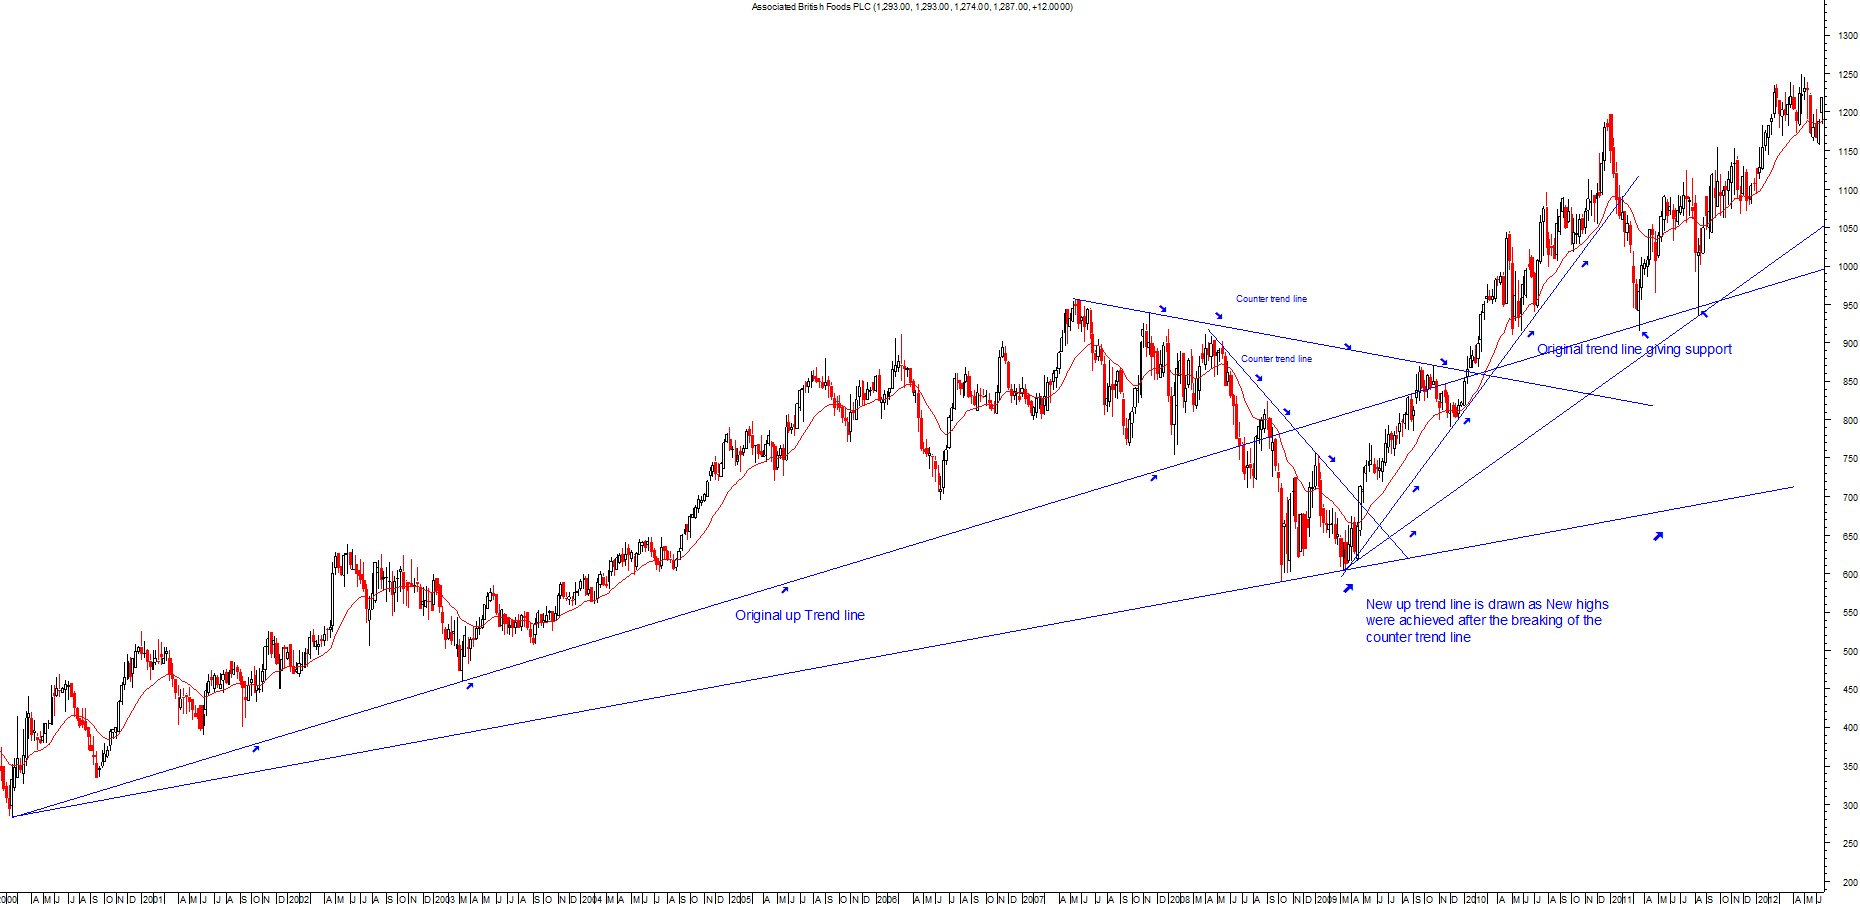
In an uptrend the idea is to buy the dips, you use the trend lines as a buying area.
The longer the trend line is in play the more significance it has, the trend line that has been in play for 1 year has more significance than one that's only been in play for a couple of months.
For a trend line break to be valid it has to close the trading day below the trend line however, sometimes this is not enough and the price breaks back up.
You do get false breaks and a way around this is to look for a 3% penetration, this would normally help to filter out false breaks but will mean a late exit.
Once a trend line breaks it normally becomes resistance so it's always good to project the line into the future(see chart above for example).
The best trend lines are the ones that have a 45 degree angle. Trend lines may have to be redrawn if they are to steep as steep trend lines are hard to maintain and the same goes for flattish trend lines.
This is a very popular and commonly used pattern in trading. This is basically a consolidation period where prices are trading within a clear range.
You draw 2 parallel lines, the top and the bottom. This is best traded in the direction of the trend.
A breakout occurs once the price finishes the day above or below the parallel lines. The target is the height of the trading range added to the break out point.
Please click on chart below for larger image
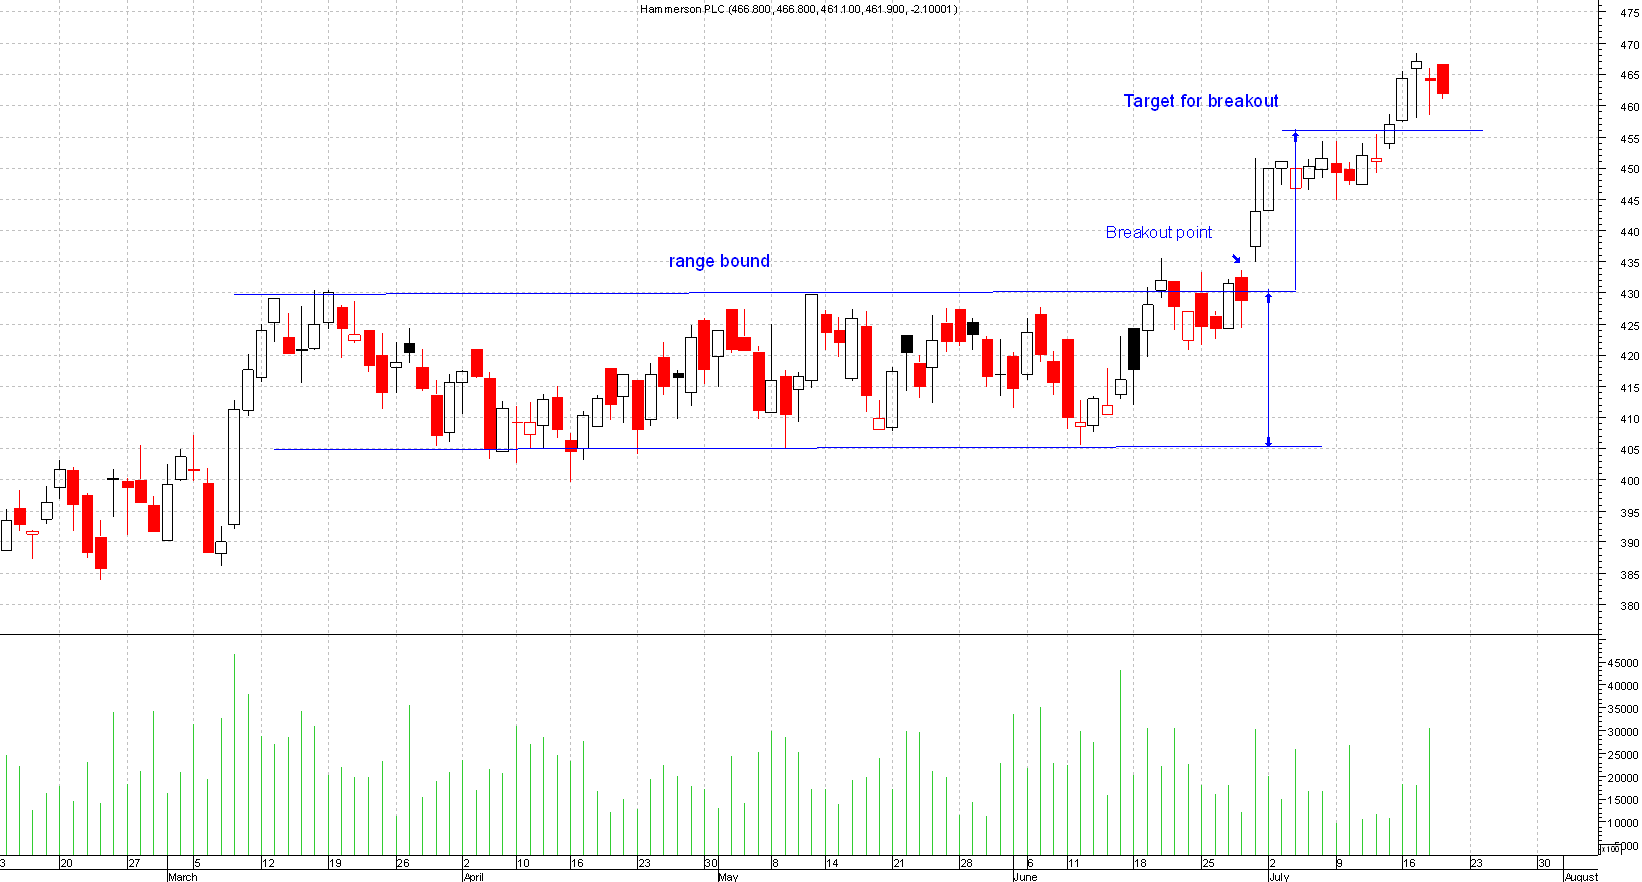
In an uptrend it's best to go long at the bottom of the range and maybe short at the top.
This is good for short term trading and this is a classic example of a buy at support and sell at resistance.
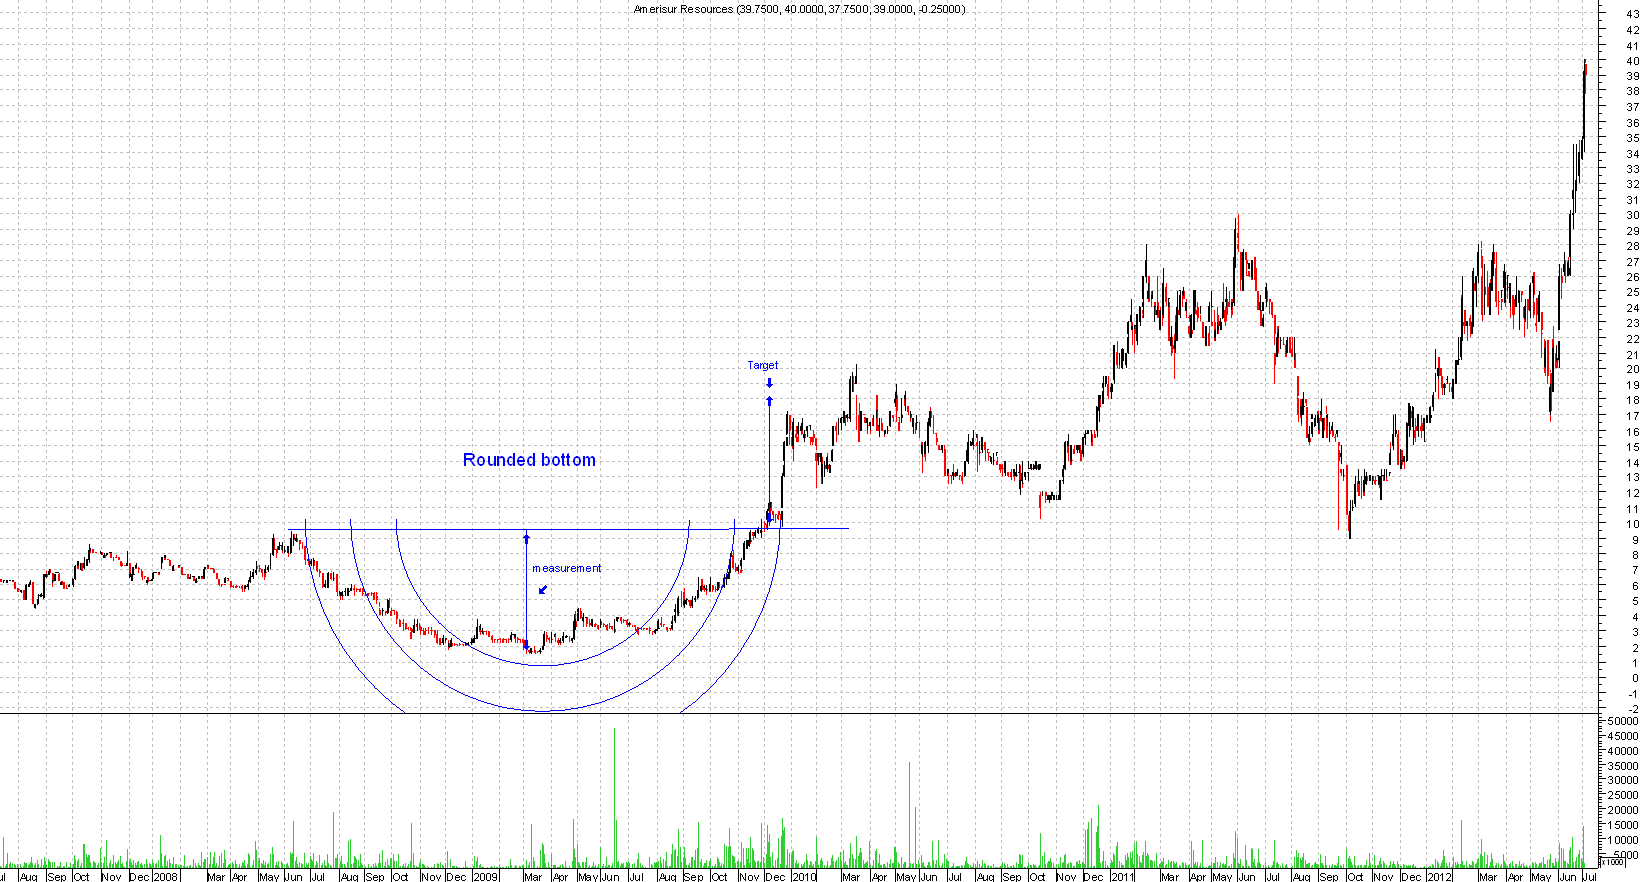
This basically is a slow downward move followed by sideways move then upwards. This takes the shape of a cup(without the handle).
This pattern can take some time to develop. Once it's got the shape of a nice cup then draw a line though the peaks of the cup and once the price breaks above the peaks of the cup you will get your buy signal.
You can measure the distance of the target, measure from the top of the cup to the bottom then you project that line from the breakout point, you then have your target.
Please click on chart below for larger image
After a strong move higher a share will need to retrace, this builds up strength for the share to go higher.
Shares cannot go up in a straight line forever, when the re-trace comes it normally heads towards the 50% of the prior move higher.
So if a share went from 50-100 then the area to add longs will be 75, waiting for a re-trace is the smart move rather than chasing a share higher.
Most gamblers will chase the share higher, the smart investor will wait for a better entry.
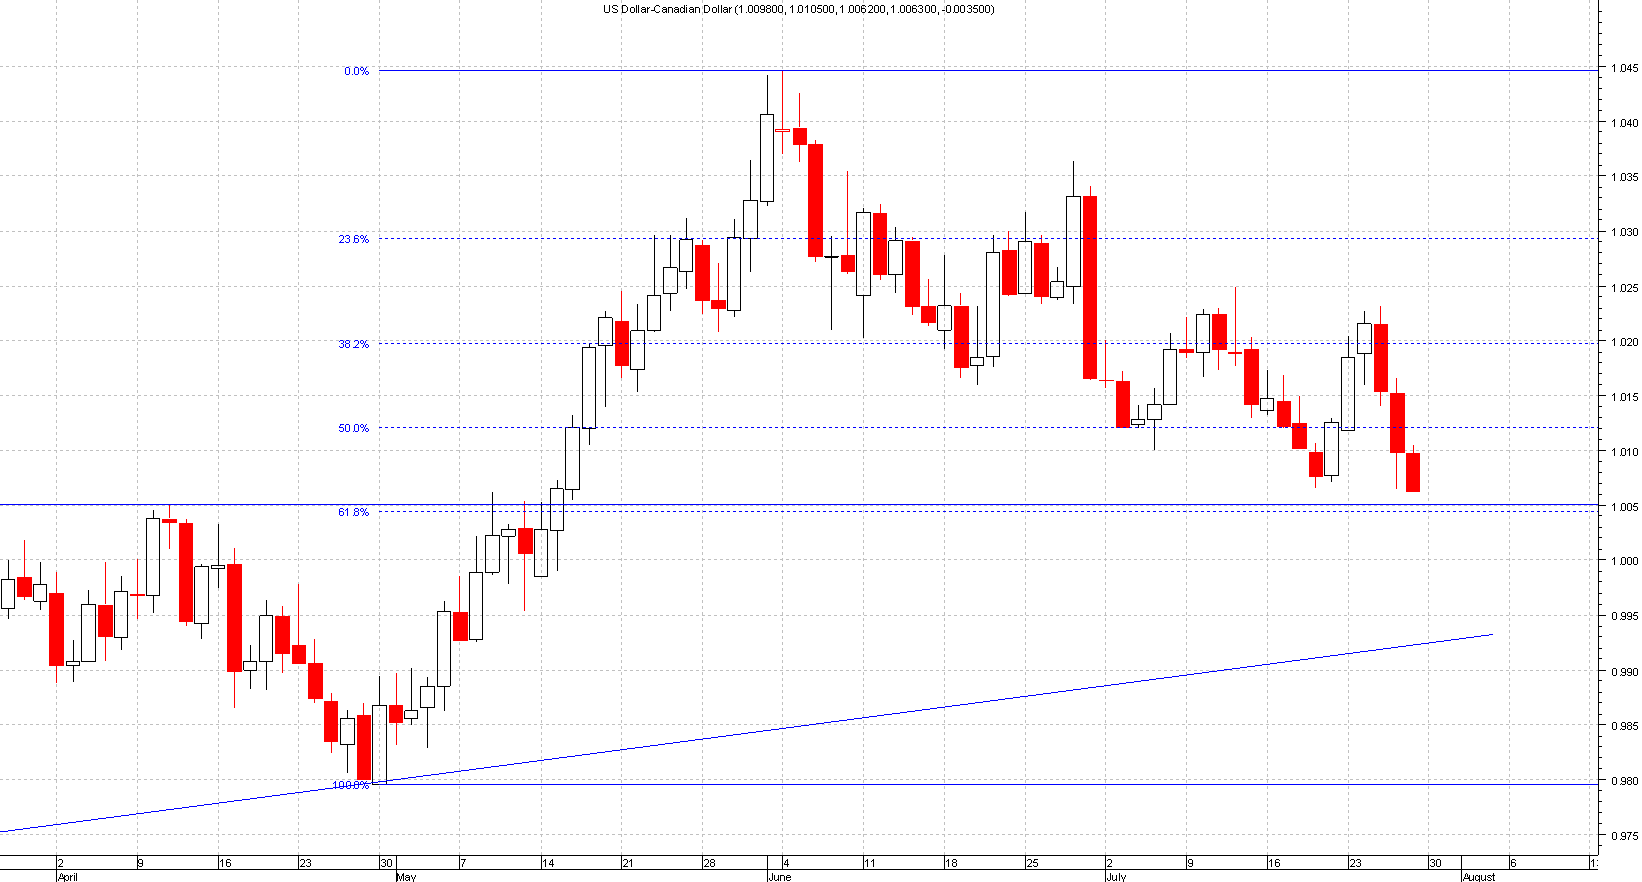
It's good to use the Fibonacci Ratio in this case:
• 23.8 fib - This level usually has a big influence if the trend is really strong.
• 38.2 fib - This is a good area to enter as well.
• 50.0 fib - This is the half way point and also has an impact.
• 61.8 fib - This level is the last place to find an entry. If the price goes beyond this level then chances are its more than just a correction and more likely a trend reversal.
If you look at the chart below you can see how the fibonacci ratio played perfect support on the way down, ideal trading opportunities.
Please click on chart below for larger image
Support is a level where buyers overwhelm sellers, supports can come in many forms.
A support can be found at:
• Previous reaction low
• Trend lines
• Gaps
• Fibs
• Moving averages
• Ichimuku cloud bottoms
You should only buy at known supports and anywhere else is simply gambling.
This is why most traders lose, why chase a price when it can come to you under your own terms?
Please click on chart below for larger image
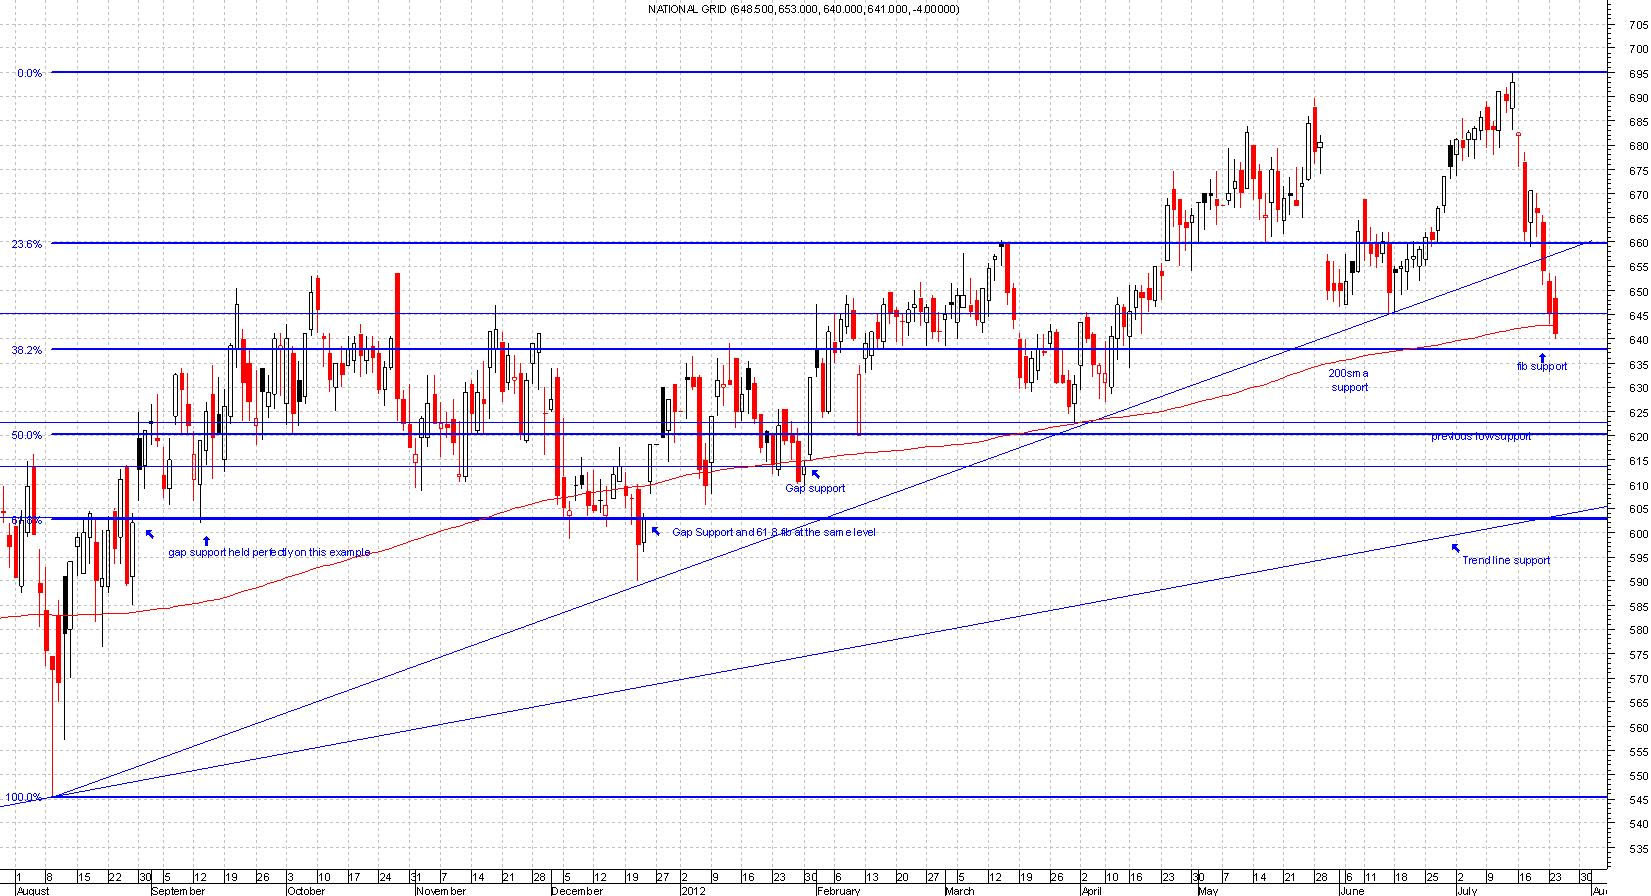
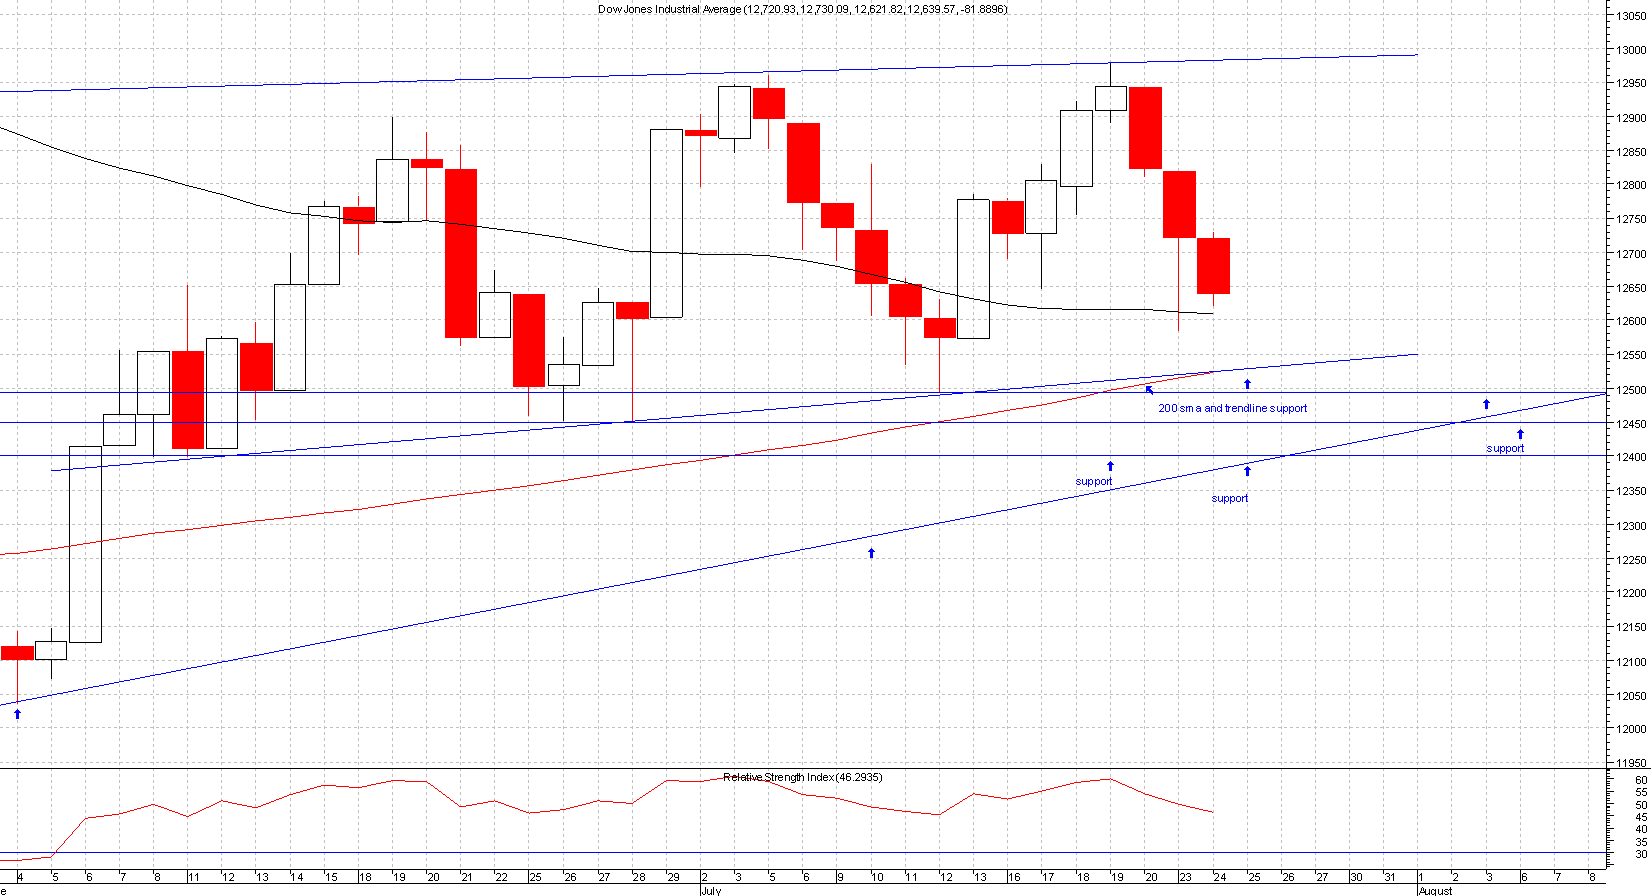
The more touches to a support level the stronger it becomes and best entries are when you get two or more supports converging at the same level.
The chart below shows the 200 simple moving average (sma) and trend line supports converging in the same place. That's the best level to go long in this example.
Once support gets penetrated it becomes resistance:
Please click on chart below for larger image