The hammer is one of the simplest yet most powerful candlestick patterns you'll learn. Its distinctive shape—a small body with a long lower shadow—tells a clear story about rejection of lower prices. When you understand how to trade hammers correctly, you'll start seeing profitable setups that other traders miss. This guide takes you through everything you need to know about hammers, hanging men, and related patterns.
What Is a Hammer Candlestick
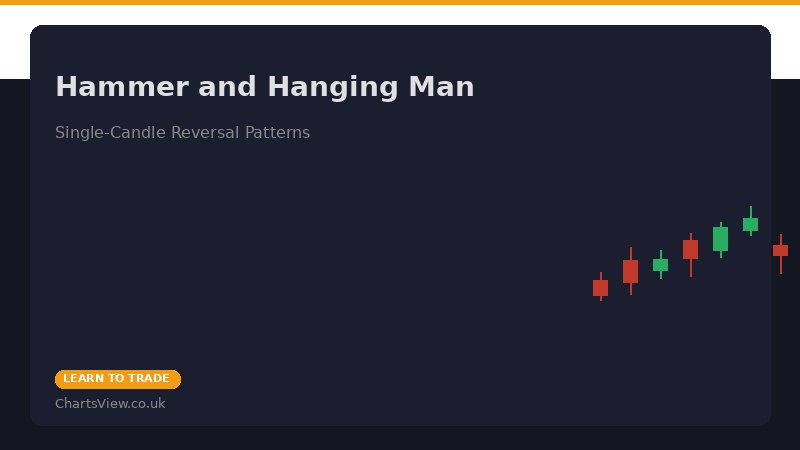
A hammer candlestick has a specific appearance: a small body positioned near the top of the trading range, with a long lower shadow (wick) that typically extends at least twice the height of the body. Ideally, the upper shadow is minimal or non-existent. The colour of the body (green or red) is less important than the structure itself, though green bodies are slightly more bullish.
What does a hammer tell you? During the period, sellers pushed the price down significantly. Then buyers stepped in and pushed the price back up, closing near the open or higher. The long lower shadow proves that the lower prices found no demand—buyers rejected them. This rejection of lower prices is the hammer's core message.
The hammer gets its name from the visual appearance: it looks like a hammer with the handle pointing downward. The head of the hammer represents the small body, and the handle is the long lower shadow—exactly what you'd see if you flipped a hammer upside down.
Hammer at Bottom of Downtrend: Bullish Reversal
The hammer is most powerful when it forms at the bottom of a downtrend. After days or weeks of declining prices, a hammer shows that sellers have finally exhausted themselves and buyers are stepping in.
Here's the practical scenario: The price has been declining steadily. On one day, it opens and sellers push it down further, making a new low. But then something happens—buyers step in. They defend the lower prices and push the market back up, closing near the open or higher. The long lower shadow is evidence of this buying demand.
This pattern is significant because it shows a shift in sentiment. The trend that was down is now being questioned. Sellers are weakening, and buyers are strengthening. If the next candle confirms this reversal by closing above the hammer's open, you have a tradeable setup.
The location matters enormously to hammer reliability. A hammer at a major support level, round number, or moving average is far more significant than a hammer that forms in the middle of a decline with no nearby support. The support level identifies where buyers previously stepped in, and the hammer shows them stepping in again.
Real-World Example
Imagine a UK stock has declined from £5.00 to £4.50 over five days. On day six, it opens at £4.48 and sellers push it to £4.35, the lowest point in weeks. But then, halfway through the day, buyers emerge. By the close, the stock finishes at £4.47—nearly back where it opened. The lower wick from £4.35 to £4.47 is the hammer's lower shadow. The small body between £4.47 and £4.48 is the hammer's body.
This hammer at the bottom of the downtrend, combined with buyers rejecting £4.35, signals a potential reversal. On day seven, if the stock closes above £4.48, that's your confirmation. That's when you'd consider entering long.
Hanging Man at Top of Uptrend: Bearish Reversal
The hanging man is the bearish counterpart to the hammer. It has the same shape—small body with long lower shadow—but it forms at the top of an uptrend instead of at the bottom.
The hanging man tells the opposite story. During an uptrend, the price rallies and makes a new high, but then sellers step in. They push the price down significantly during the period. Although the price recovers somewhat and closes near the open or slightly higher, the long lower shadow reveals something important: the market tested lower prices, found some resistance to them (from the buyers who originally pushed it up), but then buyers abandoned those lower prices.
This is a sign that the uptrend may be losing conviction. If the next candle confirms the reversal by closing below the hanging man's open, you may have a tradeable bearish setup.
Like the hammer, the hanging man's significance depends on location. A hanging man at a major resistance level or previous swing high is far more meaningful than one in the middle of an uptrend. The resistance level shows where sellers previously defended, and the hanging man shows them defending again.
Understanding the Difference
Here's the key difference between a hammer and a hanging man: the location determines the name and the trading signal. The same candlestick shape at the bottom of a downtrend is a hammer (bullish). The same shape at the top of an uptrend is a hanging man (bearish).
This is why context matters so much in technical analysis. A candlestick's meaning changes depending on where it forms. Always consider the prior trend and the price level when identifying these patterns.
Inverted Hammer and Shooting Star
Inverted Hammer
An inverted hammer is the opposite shape—a small body near the bottom with a long upper shadow (wick). The body can be at or near the low of the candle, and the upper shadow extends significantly upward.
The inverted hammer forms at the bottom of a downtrend. During the period, buyers pushed the price up significantly, but then sellers stepped in and pushed it back down, closing near the open or lower. The long upper shadow shows that buyers tested higher prices but found sellers willing to defend.
This is less bullish than a hammer. While it shows some buying interest (the upper shadow), the fact that the close is near the bottom suggests caution. The inverted hammer is a weaker reversal signal than the hammer and requires strong confirmation.
Shooting Star
A shooting star is an inverted hammer that forms at the top of an uptrend. It has a small body near the bottom with a long upper shadow. The pattern shows that buyers pushed the price up, but sellers stepped in and pushed it back down, closing near the open or lower.
The shooting star is a bearish reversal pattern at tops. The long upper shadow shows rejection of higher prices. The close near the bottom of the range shows sellers have taken control. Like the hanging man, it requires confirmation on the next candle before you trade it.
Shadow-to-Body Ratio Requirements
Not every candle with a long wick is a hammer. There are specific ratio requirements that make a hammer a hammer.
The general rule: The lower shadow should be at least 2-3 times the height of the body. So if the body is 10 pips tall, the lower shadow should be at least 20-30 pips.
Why does this matter? If the shadow is only slightly longer than the body, it's not much of a rejection signal. A true hammer has a dramatically long shadow, showing significant rejection of the lower prices. The longer the shadow relative to the body, the stronger the signal.
Upper shadow consideration: A hammer should have minimal or no upper shadow. If the upper shadow is nearly as long as the lower shadow, it's not a hammer—it's likely a hanging man (if at an uptrend top) or a spinning top (if in the middle of a trend).
Different trading communities use different ratio requirements. Some are strict about requiring at least a 3:1 ratio, while others accept a 2:1 ratio. The key is to be consistent with your definition and to understand that a slightly longer shadow makes a stronger signal.
On very liquid markets with tight spreads, you might see ratios of 2:1. On less liquid or more volatile markets, you might need 3:1 or higher for the pattern to be meaningful. Adjust your standards based on the instrument you're trading.
Colour of the Body: Does It Matter?
This is an important point many traders overlook. For a hammer at a bottom, a green (bullish) body is more bullish than a red (bearish) body, but both are valid hammers.
Green hammer: The close is above the open, showing that buyers are more aggressive. A green hammer at support is a stronger signal than a red hammer at the same level.
Red hammer: The close is below the open (though still near the open, because it's a small body), showing some continued selling pressure. But the fact that buyers drove the price back up from the lows proves there's buying interest even if the close is red.
The research on this is clear: green hammers at bottoms have better results than red hammers, but both are tradeable if confirmed. The colour is secondary to the structure and location.
Similarly, for a hanging man at a top, a red hanging man is more bearish than a green one. But both are valid hanging man patterns if the structure and location are correct.
The key is not to be overly strict about colour. A red hammer at strong support with good volume can still be a profitable trade if confirmed. Focus on structure, location, and volume before worrying too much about body colour.
Confirmation Candle Requirements
This is absolutely critical: never trade a hammer or hanging man without a confirmation candle.
For a hammer at the bottom: Your confirmation comes when the candle following the hammer closes above the hammer's open. This proves that the buying interest shown by the hammer has genuine follow-through. The price doesn't just bounce—it pushes higher.
For a hanging man at the top: Your confirmation comes when the candle following the hanging man closes below the hanging man's open. This proves that the selling pressure suggested by the hanging man is real and will continue.
Why wait for confirmation? A hammer by itself doesn't tell you whether buyers have taken control. It just shows a moment of buying during a downtrend. The confirmation candle proves that this buying is genuine and will lead to further upside. Without it, you're just guessing.
What if confirmation doesn't come? If the hammer forms but the next candle doesn't confirm (closes below the hammer's open), then it was just a bounce within the downtrend. The pattern failed, and you were right to wait for confirmation because entering on the hammer alone would have been a losing trade.
Trading Hammer Setups with Examples
Example 1: FTSE 100 Hammer at Support
The FTSE 100 has been declining. It approaches the 7500 level, where it has bounced previously. On day 1, it opens at 7520 and closes at 7485—a bearish day. On day 2, it opens at 7480 and sells off to 7450, but then rallies back to 7515 by the close. The lower wick from 7450 to 7515 is substantial—about 65 points. The body from 7480 to 7515 is about 35 points. The ratio is nearly 2:1, making this a valid hammer.
Moreover, 7500 is a key round number level. The hammer forms right at this level, making it particularly significant.
On day 3, you wait for confirmation. If the FTSE closes above 7515 (above the hammer's open), you have confirmation. Your entry would be a break above 7515, with your stop loss at 7450 (just below the hammer's low). Your first target could be 7600 (previous swing high) or 7550 (midpoint between your entry and next resistance). Your risk is about 65 points. If you aim for a 1:2 or 1:3 reward-to-risk ratio, your target should be 130-195 points higher, making this a worthwhile trade.
Example 2: Tech Stock Hanging Man at Resistance
A growth stock has rallied from £20 to £26 over three weeks. On day 1, it reaches £26.50, a new high. On day 2, it opens at £26.40 and rallies to £27.00 early in the session (the upper shadow). But then sellers step in. The stock falls throughout the day, closing at £26.20 (the small body). The upper wick from £27.00 to £26.20 is substantial, showing rejection of the higher prices.
This is a hanging man—it forms at the top of the uptrend, has a small body, and a long upper shadow showing rejection of higher prices.
On day 3, you wait for confirmation. If the stock closes below £26.40 (below the hanging man's open), you have confirmation of the bearish reversal. Your entry would be a break below £26.20 (the hanging man's low), with your stop loss at £27.00 (just above the hanging man's high). Your first target could be £25.50 (previous swing low) or £25.85 (midpoint between entry and next support). Again, the reward-to-risk ratio determines if it's worth trading.
Common Hammer and Hanging Man Mistakes
Trading without confirmation
The biggest mistake is entering on the hammer or hanging man itself without waiting for the confirmation candle. Always wait. Your entry will be slightly worse, but your win rate will be much better.
Wrong location interpretation
A hammer in the middle of a strong uptrend is not a bullish signal—it's just a pullback within the uptrend. Similarly, a hanging man in the middle of a downtrend is not a bearish signal. Location determines meaning. Always consider the broader trend context.
Tight stop losses
Some traders place their stop just a few pips/points beyond the pattern, thinking they're minimizing risk. But this means normal market noise stops them out before the reversal develops. Place your stop beyond the entire pattern's extreme (beyond the shadow, not just the body).
Ignoring volume
A hammer on extremely light volume is less reliable than one on normal or increasing volume. Volume confirms that genuine buying (for hammers) or selling (for hanging men) is occurring. Check volume before entering.
Wrong shadow-to-body ratio
If the shadow is only slightly longer than the body, it's not a strong hammer or hanging man. Stick to your ratio requirements. A 3:1 ratio is stronger than a 2:1 ratio.
Trading against the broader trend
A hammer at the bottom of a downtrend within a larger uptrend is meaningful, but it's less powerful than a hammer at the bottom of a downtrend within a bigger downtrend. Consider multiple timeframes. A pullback pattern on a lower timeframe is less significant than a reversal pattern on the daily or weekly chart.
When Hammers and Hanging Men Fail
No pattern has a 100% success rate. Hammers and hanging men fail when:
They form away from key levels. A hammer in the middle of a decline, far from any support, is less reliable. The lack of a key level means it's just a random bounce.
They form on light volume. Low volume suggests thin market conditions rather than genuine buying or selling interest.
The broader market trend is too strong. A hammer at support during a panic sell-off might still be overwhelmed by selling pressure. Strength of the preceding trend matters.
They're not confirmed. The most common failure is trading a hammer without waiting for the confirmation candle. The next candle closes the wrong way, and you're in a losing trade immediately.
Practical Application
Here's how professional traders use hammers and hanging men:
Identify key support levels on your chart. Wait for a hammer to form at these levels. Don't enter immediately. Wait for the next candle to confirm by closing above the hammer's open. Calculate your position size based on the distance to your stop loss, keeping risk to 1-2% per trade. Once confirmed, enter a break above the hammer's body. Trail your stop as the market moves in your favour. Exit at a predetermined target or based on trend exhaustion.
This disciplined approach—waiting for confirmation, using key levels, proper position sizing, and defined risk—is what separates profitable traders from those who struggle. Hammers and hanging men are powerful tools when used correctly. Master them, and you'll have a reliable way to identify reversals across all markets.