The Relative Strength Index, or RSI, is one of the most widely used indicators in trading. It measures how strong recent gains have been compared with recent losses, on a scale from 0 to 100. Used well, it helps you spot stretched moves, fading momentum and good moments to buy pullbacks.
How the RSI is worked out
The RSI was created by J. Welles Wilder and published in 1978. It compares the average gain on up days with the average loss on down days over a set number of periods, usually 14.
- First, work out the average gain and the average loss over the last 14 periods.
- Divide the average gain by the average loss. This is the relative strength (RS).
- RSI = 100 − (100 ÷ (1 + RS)).
You never need to do this by hand; every charting package does it for you. What matters is the idea: when gains dominate, the RSI rises towards 100; when losses dominate, it falls towards 0.
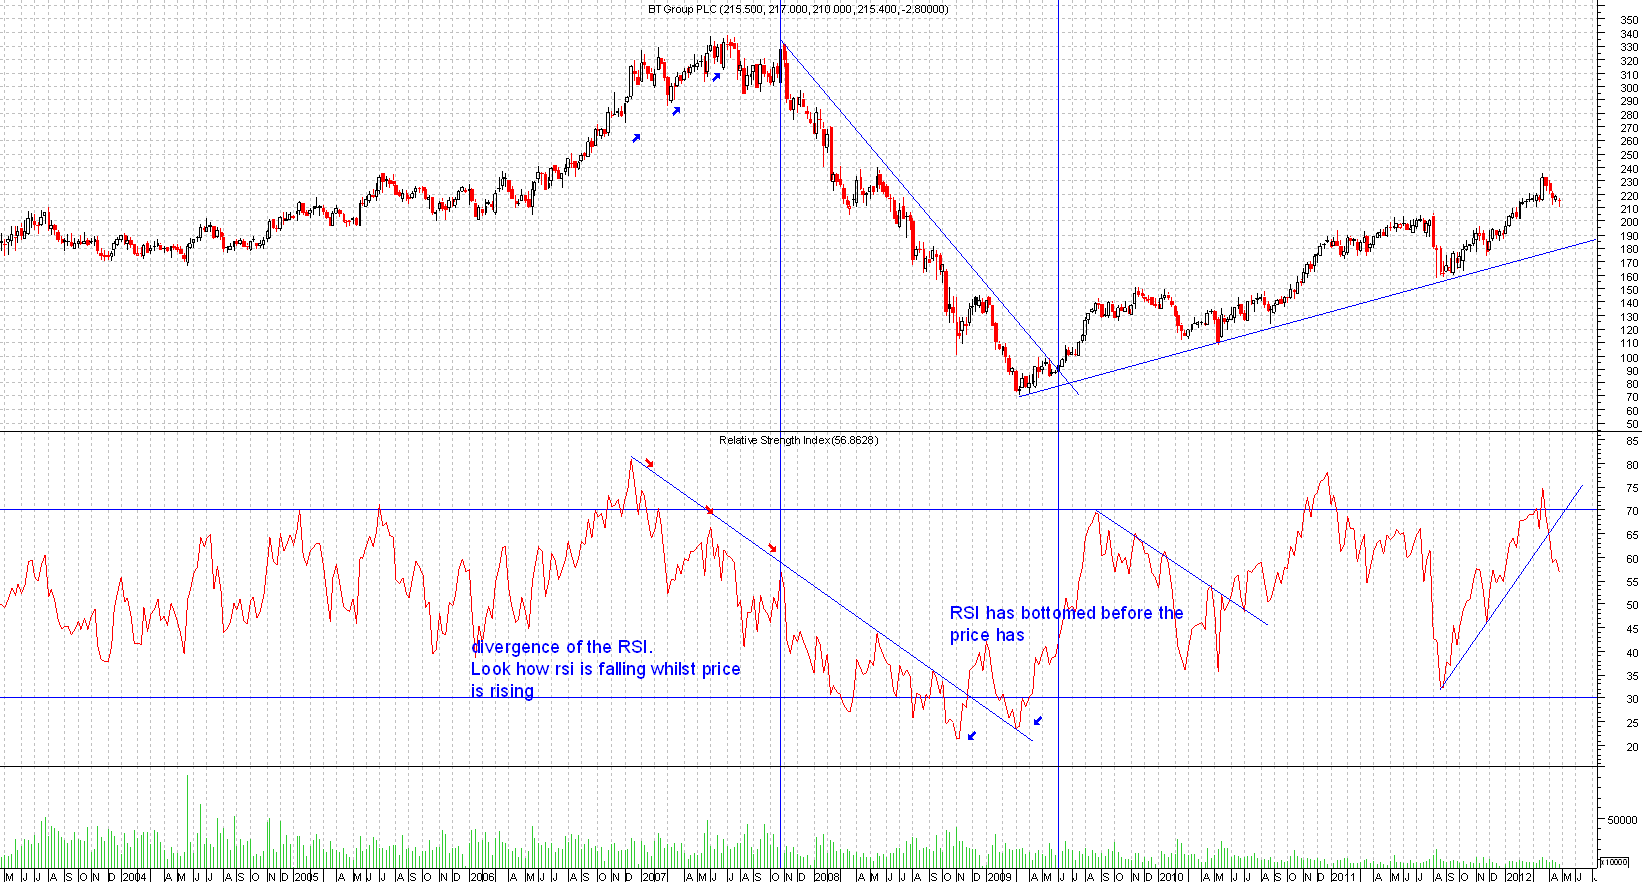
Overbought and oversold
The classic levels are 70 and 30. Above 70 is called overbought; below 30 is called oversold. These words are often misunderstood. Overbought does not mean "sell". It means the price has risen fast. In a strong uptrend, the RSI can stay above 70 for weeks while the price keeps climbing.
A more useful approach is to read the RSI in the context of the trend:
- In an uptrend, the RSI tends to stay between about 40 and 80. Dips towards 40 to 50 can be buying opportunities.
- In a downtrend, the RSI tends to stay between about 20 and 60. Rallies towards 50 to 60 can be selling opportunities.
- In a sideways range, the 70 and 30 levels work best as places to fade the move.
Divergence
Divergence is when the price and the RSI disagree. If the price makes a higher high but the RSI makes a lower high, upward momentum is fading. That is bearish divergence. If the price makes a lower low but the RSI makes a higher low, selling momentum is fading. That is bullish divergence.
Divergence is a warning, not a timing tool. Trends can carry on for a long time while divergence builds. Use it alongside price signals, such as a trend line break. Our divergence trading guide goes into much more detail.
Other ways traders use RSI
- The 50 line: RSI above 50 means gains are outweighing losses; below 50, the reverse. Some traders only buy when RSI is above 50.
- Trend lines on the RSI: you can draw trend lines on the RSI itself. A break sometimes comes before the price breaks.
- Failure swings: Wilder's own signal. For example, the RSI drops below 30, bounces, pulls back but stays above 30, then breaks above its bounce high.
- Settings: 14 is standard and used by most traders. Shorter settings make the RSI jumpier; longer settings make it smoother.
Mistakes to avoid
- Selling just because the RSI is above 70.
- Using the RSI on its own without looking at the price chart.
- Changing the settings until old signals look perfect. That rarely works going forward.
Related guides
This guide is for education only and is not financial advice. Trading carries risk; you can lose more than you expect.