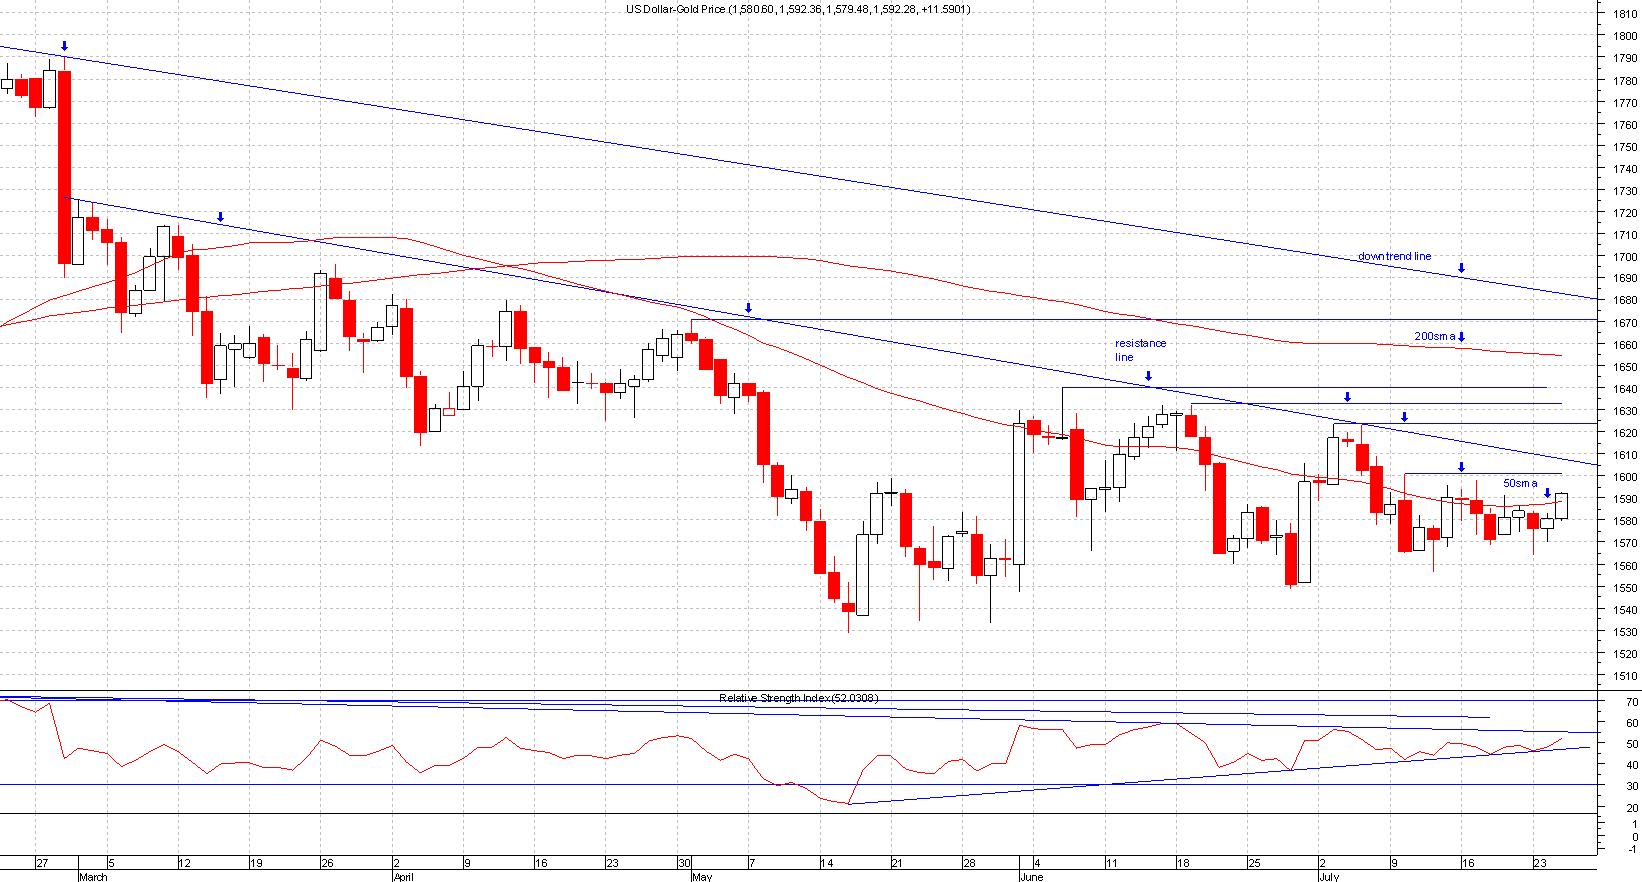
Resistances are the opposite of support levels. This is when buyers are out numbered by the sellers in the market.
This level is normally identified by a previous peak, this is the level that you should take profits.
Resistance comes in many forms:
• Previous reaction high
• Downtrend lines
• Gaps
• Fibs
• Moving averages
• Ichimuku cloud tops
Once a resistance is penetrated it normally becomes support, never buy at resistance.
If you study the chart below you should be able to tell how to draw resistance, the chart below shows examples of resistances on gold.
Please click on chart below for larger image