Not all markets trend. Many spend their time sideways, bouncing between clear support and resistance levels. These range-bound markets frustrate trend traders but offer excellent opportunities for range traders. A range is simply a defined price zone where a market repeatedly bounces between a floor (support) and a ceiling (resistance). Learning to identify and trade these ranges systematically can generate consistent profits even when bigger trends aren't available. This article explores what range trading is, how to identify ranges, the specific strategies that work, and when to abandon range trading for trending market strategies.
What is a Trading Range and How to Identify One
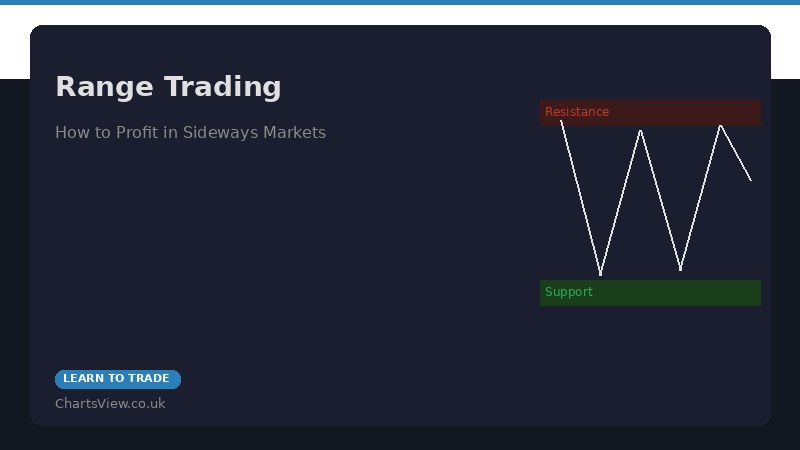
A trading range is a price zone where an asset bounces repeatedly between support (a level where buying emerges) and resistance (a level where selling emerges). The support level acts as a floor—price rebounds upward every time it approaches this level. The resistance level acts as a ceiling—price reverses downward every time it approaches this level. A clear range has well-defined upper and lower boundaries.
The most obvious ranges appear on charts as rectangular price zones. Look at an hourly chart and you see price bouncing between £100 and £105 repeatedly over a 3-day period. That's a textbook range. More subtle ranges show a pattern where bounces happen at similar prices without being perfectly rectangular—price bounces between roughly £100 and £105 with some variation, but the pattern is clear.
Visual Identification: The simplest approach is drawing a horizontal line at the support level and another at the resistance level. If price bounces off these lines multiple times (at least 2-3 times from each level), you likely have a range. Some traders use the high and low of the last N candles to define the range objectively. Others use recent swing highs and lows. The method matters less than consistency—define your ranges clearly.
Time Duration Matters: A range needs time to develop. A 1-hour range might be meaningful on an intraday chart, but on a daily chart, a 1-day range is noise. Swing traders typically look for ranges developing over days or weeks. Intraday traders look for ranges developing over hours. Scalpers look for ranges developing over minutes. The longer the range, the more significant it tends to be.
Context Matters: A range often appears after a strong move has exhausted. Price has rallied hard, then consolidates sideways in a range before deciding the next direction. Alternatively, a range appears when there's genuine uncertainty—neither buyers nor sellers are in control, so price oscillates. Understanding why the range formed helps you predict when it will break.
Identifying Range-Bound Markets on Your Charts
Not every period is a range. You need to distinguish between: (1) True ranges where price bounces between defined levels, (2) Trending markets where price is generally moving in one direction with pullbacks, (3) Volatile markets where price moves erratically without clear structure. Only true ranges are suitable for range trading strategies.
True ranges have these characteristics: Multiple touches of support and resistance within a relatively short period. Price bounces off each level multiple times. The width of the range is clear—you can define resistance and support with precision. Price stays within the range—it doesn't close below support or above resistance persistently.
Pseudo-ranges (that aren't really ranges) have these characteristics: Price looks like it's ranging but is actually making a higher low or lower high—subtle trending. Price breaks the range on the first real attempt. Support and resistance aren't well-defined—it's hard to draw clean lines. The range width changes constantly.
To identify ranges reliably, use multiple timeframes. If price is ranging on the 4-hour chart but trending higher on the daily chart, you're seeing a pullback within a larger uptrend, not a true range. Trading this with range strategies is dangerous because the daily trend bias is against range-trade exits.
Buy at Support, Sell at Resistance: The Core Strategy
The core range trading strategy is beautifully simple: buy when price reaches support, sell when price reaches resistance. That's it. Every bounce from support is a potential long entry. Every rejection from resistance is a potential short entry.
Long Entry at Support: Price approaches the support level. You place a buy order a few pips above support (to ensure execution if price bounces). Your stop loss goes below support—if the range breaks down, you exit. Your profit target is resistance. You're betting price bounces up and reaches resistance for a profitable exit. Risk to reward is typically 1:1 or 1:2 depending on range width and support/resistance distance.
Short Entry at Resistance: Price approaches resistance. You place a sell order a few pips below resistance. Your stop loss is above resistance. Your profit target is support. You're betting price reverses down and reaches support.
Position Sizing: Since you're taking multiple trades within a range, size down compared to trend trades. If you normally risk £100 per trade, risk £50 per range trade. The advantage is you can take many trades in the range (3-5 bounces per week), so even smaller per-trade risk adds up to reasonable weekly returns.
Timing Entry: Don't enter at the exact support or resistance level—that's often the worst price. Instead, enter slightly beyond the level when you see evidence of bouncing. If support is at £100, don't go long at exactly £100.00. Wait until price touches £100.05 and you see buying candles forming. This improves your entry quality.
Using Oscillators for Range Trading: RSI and Stochastic
Oscillators like the Relative Strength Index (RSI) and Stochastic are tailor-made for range trading. These indicators measure whether an asset is overbought (approaching resistance, likely to reverse) or oversold (approaching support, likely to bounce). In ranging markets, they work remarkably well.
RSI for Range Trading: The RSI ranges from 0 to 100. In range-bound markets, it oscillates between roughly 30 and 70. When RSI climbs above 70, the asset is considered overbought and likely to reverse from resistance. When RSI drops below 30, it's oversold and likely to bounce from support. You can use these levels as objective entry signals. Buy when RSI drops below 30 and starts recovering. Sell when RSI rises above 70 and starts declining.
Stochastic for Range Trading: The Stochastic indicator has two lines (%K and %D) that also range from 0 to 100. When both lines are above 80, the asset is overbought. When both are below 20, it's oversold. In ranging markets, Stochastic crossings at these extreme levels often signal bounces. When the lines cross above 20 after being below it (bullish crossover), that's a long signal at support. When the lines cross below 80 after being above it (bearish crossover), that's a short signal at resistance.
Combining Technical Levels with Oscillators: The most reliable range trades combine both. Support level is at £100 AND RSI is below 30. Both conditions confirmed = strong long entry signal. Resistance at £110 AND RSI above 70. Both confirmed = strong short signal. Single-condition entries (oscillator alone or level alone) are weaker.
Oscillators Don't Work in Trends: This is critical. In strong uptrends, RSI stays above 70 for weeks. Shorting when RSI exceeds 70 loses money repeatedly as the uptrend continues. This is the biggest oscillator pitfall. Only use oscillators in range-bound markets, not in trending markets. Check the market context first.
False Breakouts at Range Boundaries
One of the most profitable range trading opportunities comes from false breakouts. Price appears to break out of the range, moves beyond support or resistance, then reverses back inside the range. These false breakouts trap traders who entered at the "breakout" and stop out for losses. But prepared range traders can profit from them.
How False Breakouts Happen: Range traders have stop losses just outside the boundaries. When price briefly escapes the range, it triggers these stops, causing panic selling (if breaking up) or panic covering (if breaking down). Once these stops are hit, the momentum reverses and price comes back inside the range. The false breakout was a mini-trap.
Scalping False Breakouts: Alert traders watch for price breaking out of the range. The second price violates the boundary, they place a counter-trade. If price breaks above resistance, they go short targeting the middle of the range. If price breaks below support, they go long. These false breakout trades are often very quick—you can profit within 30 minutes as price reverses.
Requirements for False Breakout Trading: (1) The range is well-established with multiple confirmed bounces. (2) Price has been respecting the boundaries consistently. (3) Volume on the breakout is not extreme—extreme volume suggests a real breakout. (4) You have quick execution—these trades play out fast. (5) You use tight stops—if this is a real breakout, you need to exit quickly.
Risk Management: False breakout trading is higher-risk than normal range trading because you're trading against the breakout. Your stop loss needs to be beyond the false breakout point. If resistance is £110 and price breaks to £110.50, your short stop goes above £110.50, maybe at £110.70. This reduces your profit potential, but it protects you from real breakouts.
Stop Loss Placement in Ranges
Stop loss placement is critical in range trading. Too tight and you get stopped out by noise. Too wide and your risk becomes unacceptable. The sweet spot depends on volatility.
Volatility-Based Stops: Use the Average True Range (ATR) to size your stops. If ATR is 5 pips, place your stop 7-8 pips beyond the support or resistance level (beyond the range boundary). This gives price room to bounce without being stopped on typical intraday noise, but stops you out quickly if the range truly breaks.
Time-Based Stops: If price doesn't reach resistance within a set time (say, 4 hours), exit the trade. This prevents capital getting stuck in slow-moving ranges. If the bounce isn't developing quickly, move on to better opportunities.
Moving Stop Losses: In some ranges, once price is moving toward your target (say, after bouncing from support toward resistance), consider moving your stop loss up to break-even or trailing it behind price as it rallies. This locks in small gains if the move reverses and eliminates risk of loss.
Different Stop Approaches by Timeframe: On intraday charts (1-4 hour), stops 8-15 pips beyond boundaries work. On daily charts, stop 20-50 pips beyond (or 1-2% beyond in percentage terms) depending on volatility. Wider stops are needed on longer timeframes due to greater price swings.
When the Range Breaks: Switching to Breakout Mode
Eventually, ranges break. Price escapes definitively beyond support or resistance and doesn't come back. When this happens, you need to switch strategies immediately. Continue trading range bounces after a real breakout and you'll lose money. The trend has changed.
Recognising a Real Breakout vs. False Breakout: Real breakouts have these characteristics: (1) Strong volume—significantly above average volume. (2) Distance—price breaks beyond the boundary by at least 1-2 times the normal range width. (3) Persistence—price stays outside the range for multiple candles, doesn't rush back. (4) Follow-through—price continues accelerating in the breakout direction.
Switching Strategy: Once a breakout is confirmed (usually takes 1-2 candles), abandon range trading. Stop trying to short breakouts above resistance or buy breakouts below support. Instead, switch to trend following. If price breaks above resistance, look for opportunities to buy pullbacks into the broken resistance (now support). If price breaks below support, short bounces to the broken support (now resistance). The range is over. Trends begin.
The Transition Trade: Many traders place a trade specifically for the range breakout. Once the range boundary breaks decisively, they enter a trade in the breakout direction with a target further out (past next resistance or support). This catches the first wave of the new trend. Then they watch the new trend develop and adjust their strategy to trend-following approaches.
Range Trading vs. Trend Trading: Which to Use
The market is either trending or ranging. You need to identify which applies and trade accordingly. Trying to range trade in a trend leads to losses. Trying to trend trade in a range leads to losses. The key skill is identifying the market regime.
Market Regime Identification: Look at your chart. Is price making higher highs and higher lows (uptrend)? Lower highs and lower lows (downtrend)? Or similar highs and lows (range)? This is your market regime. Check multiple timeframes—price might be ranging on the 4-hour chart but trending up on the daily chart.
Percentage of Time in Range vs. Trend: Markets spend roughly 30% of their time in ranges and 70% in trends. But this varies. Some assets (like index funds) trend for extended periods. Some (like range-bound currencies) spend more time ranging. Know your assets' tendencies.
Profiting from Both: Successful traders have strategies for both. When markets range, use range trading (buy support, sell resistance). When markets trend, use trend trading (buy dips in uptrends, sell bounces in downtrends). The skill is switching between them based on what the market is actually doing.
Hybrid Approach: Some traders trade ranges but use tighter exits than trend traders. If trading support/resistance bounces in a range that you suspect might be breaking, take profits faster and use tighter stops. This hybrid approach protects you if the range breaks whilst capturing profits from range bounces.
Time in Range: How Range Width Affects Breakout Potential
A useful principle: the longer an asset stays in a range, the larger the eventual breakout tends to be. A narrow range that lasts weeks often breaks violently. A wide range might break more slowly. This affects your trading approach.
The Basing Principle: When a stock ranges for 3 months before breaking out, it often makes a much bigger move than a stock that ranges for 1 week before breaking. The longer traders are trapped in the range, the more compressed the energy, the bigger the eventual release.
Implications for Range Traders: If you're in a 2-week-old tight range, be prepared to exit quickly when a breakout occurs—the move could be powerful. If you're in a 3-month-old wide range, be prepared for a breakout to extend further than normal.
Trading the Approaching Breakout: As a range matures (been ranging for weeks), start looking for the breakout. Don't just keep range trading forever. Watch for: (1) Volume increasing in one direction. (2) Oscillators (RSI, MACD) showing divergences—price making similar highs but indicators making lower highs. (3) False breakouts becoming more pronounced and violent. These are signs the range is about to break seriously.
Positioning for the Breakout: Some traders reduce range trades as a range matures and position for the breakout. If you suspect an upside breakout, you might take only short trades at resistance (capturing longs) and hold cash. When the upside breakout comes, you're positioned to ride it.
Practical Range Trading Examples
Example 1: FTSE 100 Daily Range The index consolidates between 7,500-7,700 for 3 weeks. You buy support at 7,510 with a stop at 7,490. Your target is resistance at 7,690. Price rallies and hits 7,680, where you take profits 85% of target. You repeat this trade 4 times over 3 weeks, winning each time. Total profit: 4 successful trades × £60 per trade = £240 on a £100 risk per trade. This is textbook range trading.
Example 2: GBP/USD Range Break The pair ranges between 1.2700-1.2800 for 5 days. You're taking range trades, buying at 1.2705, selling at 1.2795. On day 6, strong NFP data is released, pushing USD higher. GBP/USD breaks below 1.2700 on heavy volume. You immediately stop taking range bounce trades. Instead, you short any bounce back to 1.2700 (now broken resistance) with a target at 1.2650. The range is over. You switch to trend strategy.
Example 3: False Breakout Scalp A stock ranges between £50-£55 for days. At 2pm, price breaks above £55.20 on low volume. You immediately short, targeting £54.50 (middle of range) with stop at £55.50. Price quickly reverses back inside the range as the false breakout traders' stops are hit. You cover your short at £54.60 and pocket £60 profit on a quick 30-minute trade. False breakout captured.
Range trading works beautifully in range-bound markets. The strategy is simple, the risk is defined, and profits come regularly. The key is recognising when you're in a range (not a trend), executing the strategy consistently, and exiting immediately when the range breaks. Master this and you've added a powerful tool to your trading arsenal.