A pennant is a small triangle that forms straight after a sharp move. The price pauses, the range narrows for a short while, and then the trend usually carries on. Pennants are close cousins of flags: the only real difference is the shape of the pause.
What a pennant looks like
First comes a fast, steep move on strong volume: the flagpole. Then the price trades in a small, tightening range, with lower highs and higher lows, like a tiny symmetrical triangle. The breakout usually comes in the same direction as the pole.
The difference between a pennant and a symmetrical triangle is mostly size and time. A pennant is short, usually one to three weeks on a daily chart. A symmetrical triangle can take months. On hourly or 15-minute charts, pennants can form in hours.
Pennants tend to appear around the halfway point of a move, which is why the measured-move target works reasonably well.
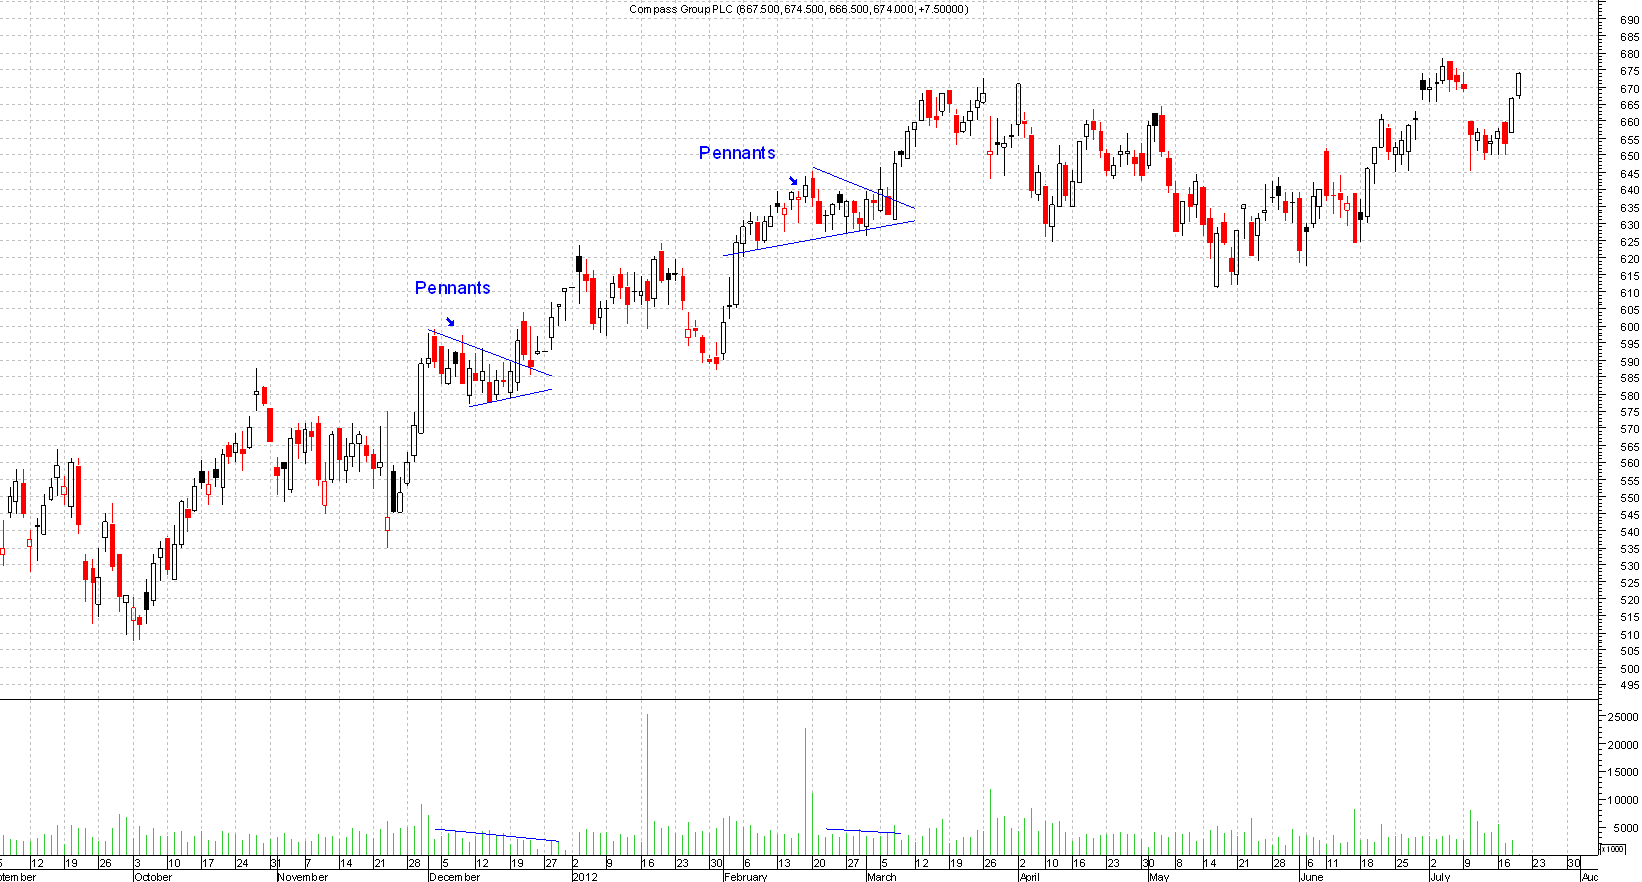
Pennant or flag?
A flag pauses inside two parallel lines that slope against the trend. A pennant pauses inside two lines that come together. Both need a flagpole, both should be short, and both are traded the same way.
How to trade a pennant
- Entry: on a close outside the pennant in the direction of the pole.
- Stop: on the other side of the pennant.
- Target: add the length of the pole to the breakout point for a bullish pennant, or subtract it for a bearish one.
Volume matters. Heavy volume on the pole, quiet trading inside the pennant, and a pick-up in volume on the breakout is the classic picture.
Mistakes to avoid
- Trading a pennant with no clear pole in front of it.
- Waiting too long. If the pennant keeps narrowing for weeks, the move has run out of steam.
- Moving your stop further away when the price wobbles. If it breaks the wrong way, accept it and step aside.
Related guides
This guide is for education only and is not financial advice. Trading carries risk; you can lose more than you expect.