The head and shoulders is the best-known reversal pattern in technical analysis. It forms at the top of an uptrend and shows buyers running out of strength. Three peaks form, with the middle one highest, and when the price breaks the line under them, the uptrend is usually over.
What a head and shoulders looks like
- Left shoulder: the price rises to a peak, often on good volume, then pulls back.
- Head: the price rallies to a higher peak, often on lighter volume, then falls back to around the level of the last low.
- Right shoulder: the price rallies again but fails below the head, usually on even lighter volume, then falls.
- Neckline: a line joining the two lows between the peaks. It can be flat or slightly sloped.
The pattern is complete only when the price closes below the neckline. Until then, it is just a set of peaks.
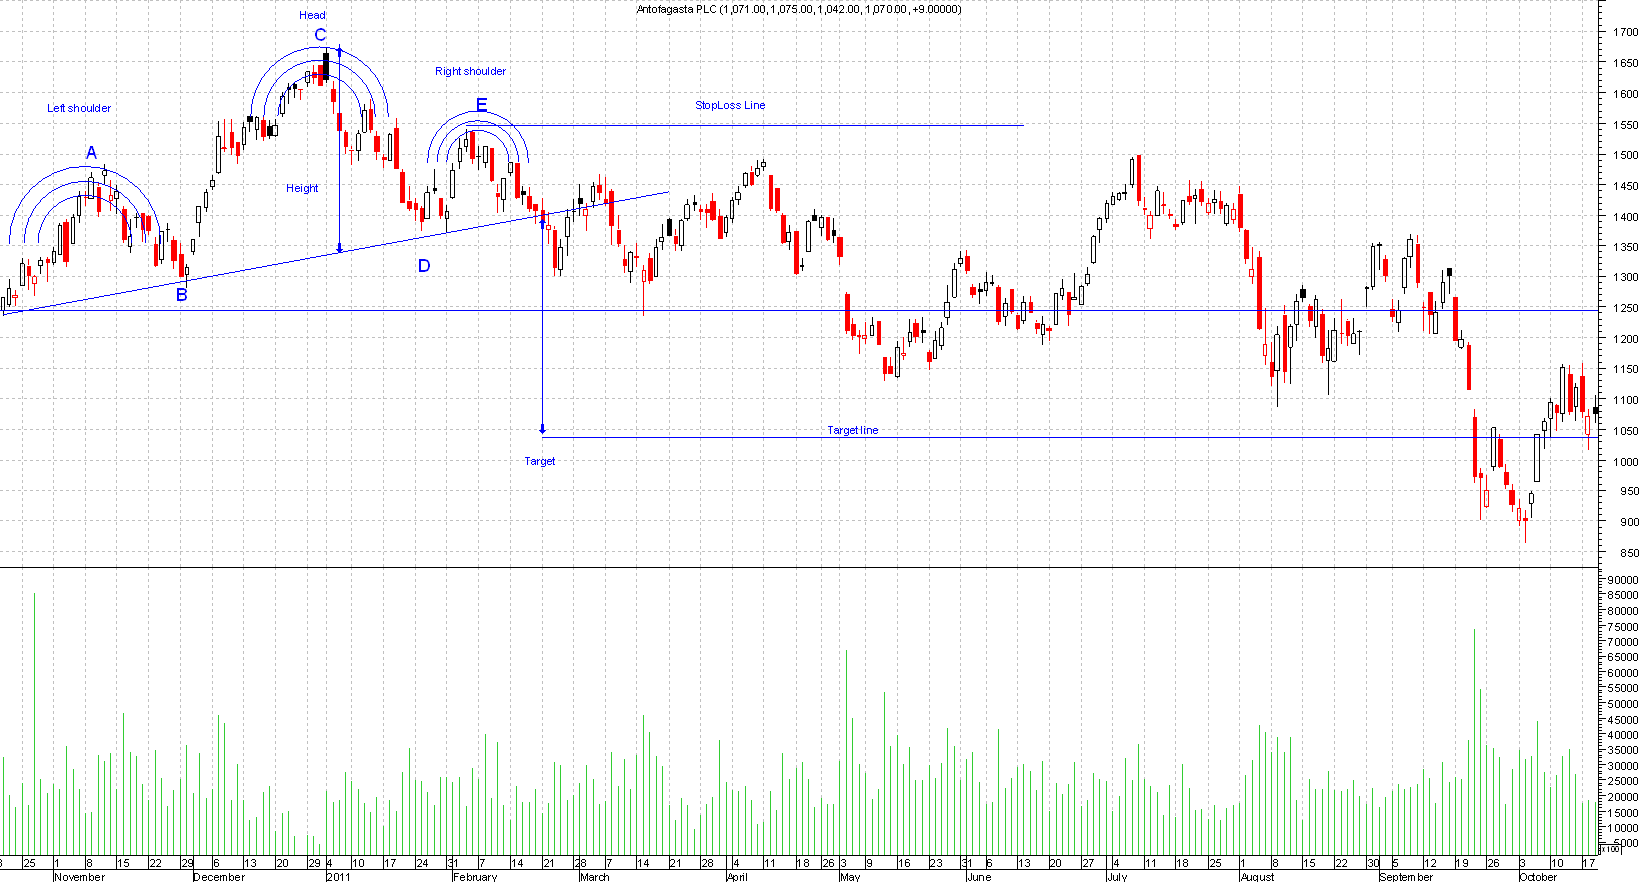
Why it works
In a healthy uptrend, each rally makes a higher high and each pullback stays above the last low. The head and shoulders breaks that rhythm. The right shoulder is a lower high, and the neckline break is a lower low. That change in market structure is what makes the pattern matter.
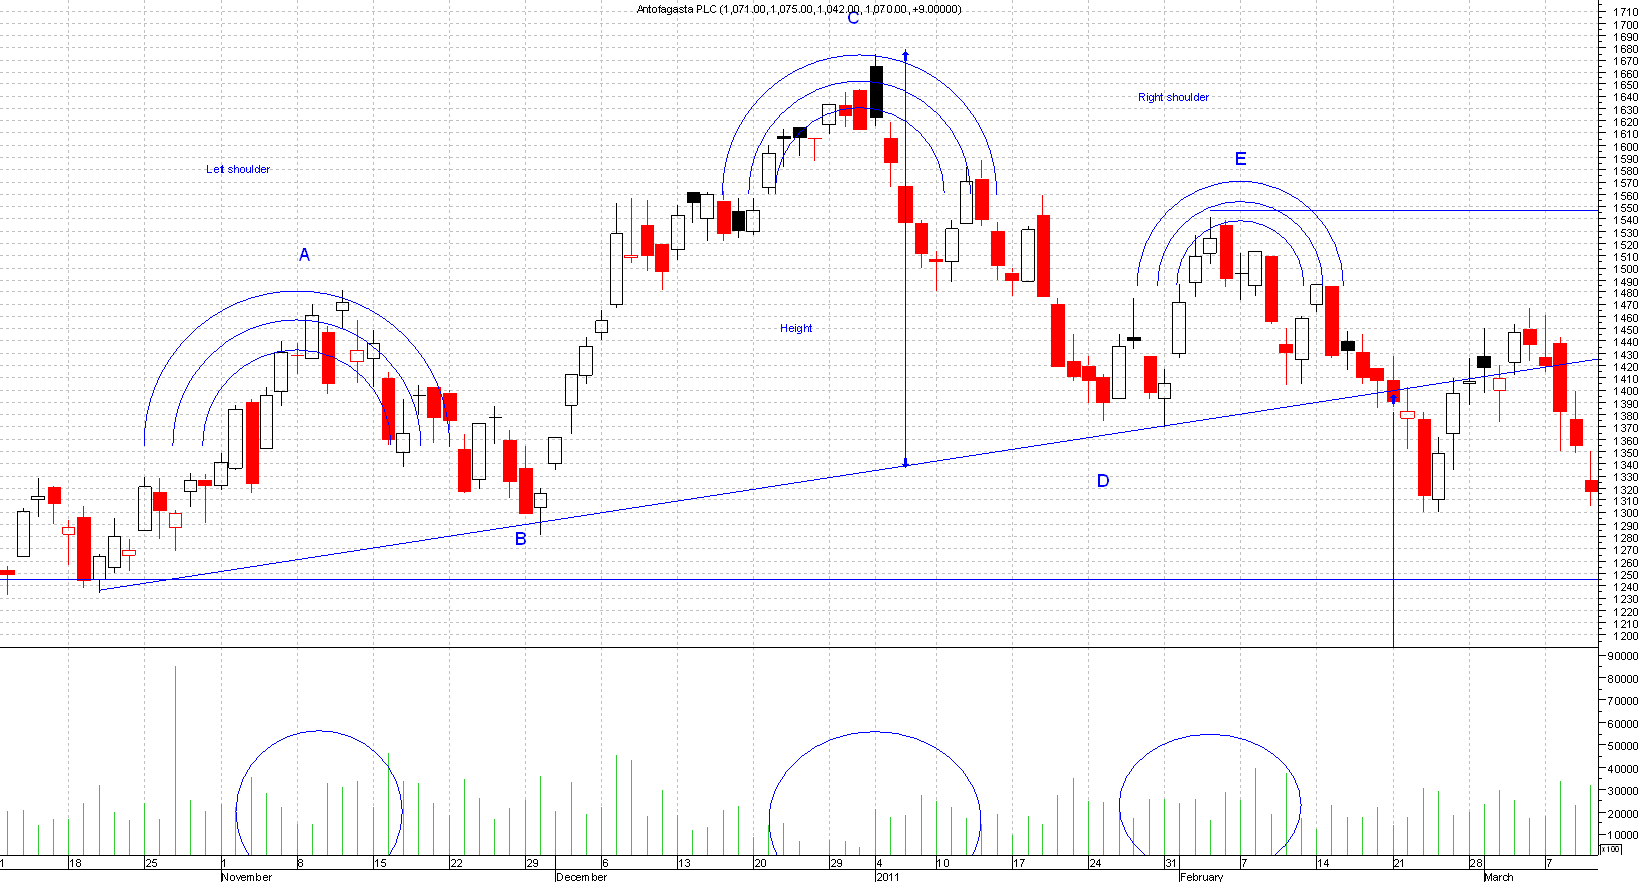
How to trade a head and shoulders
- Entry: sell, short or take profits on a close below the neckline. Prices often come back up to test the broken neckline from below, which gives a second chance to act.
- Stop: above the right shoulder.
- Target: measure from the top of the head straight down to the neckline and subtract that distance from the breakout point.
Mistakes to avoid
- Acting before the neckline breaks. Many "heads and shoulders" never complete.
- Seeing the pattern everywhere. It should form after a clear uptrend, and the shoulders should be roughly balanced.
- Ignoring volume. Falling volume on the head and right shoulder, then a pick-up on the break, adds weight to the signal.
Related guides
This guide is for education only and is not financial advice. Trading carries risk; you can lose more than you expect.