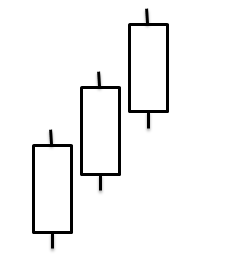
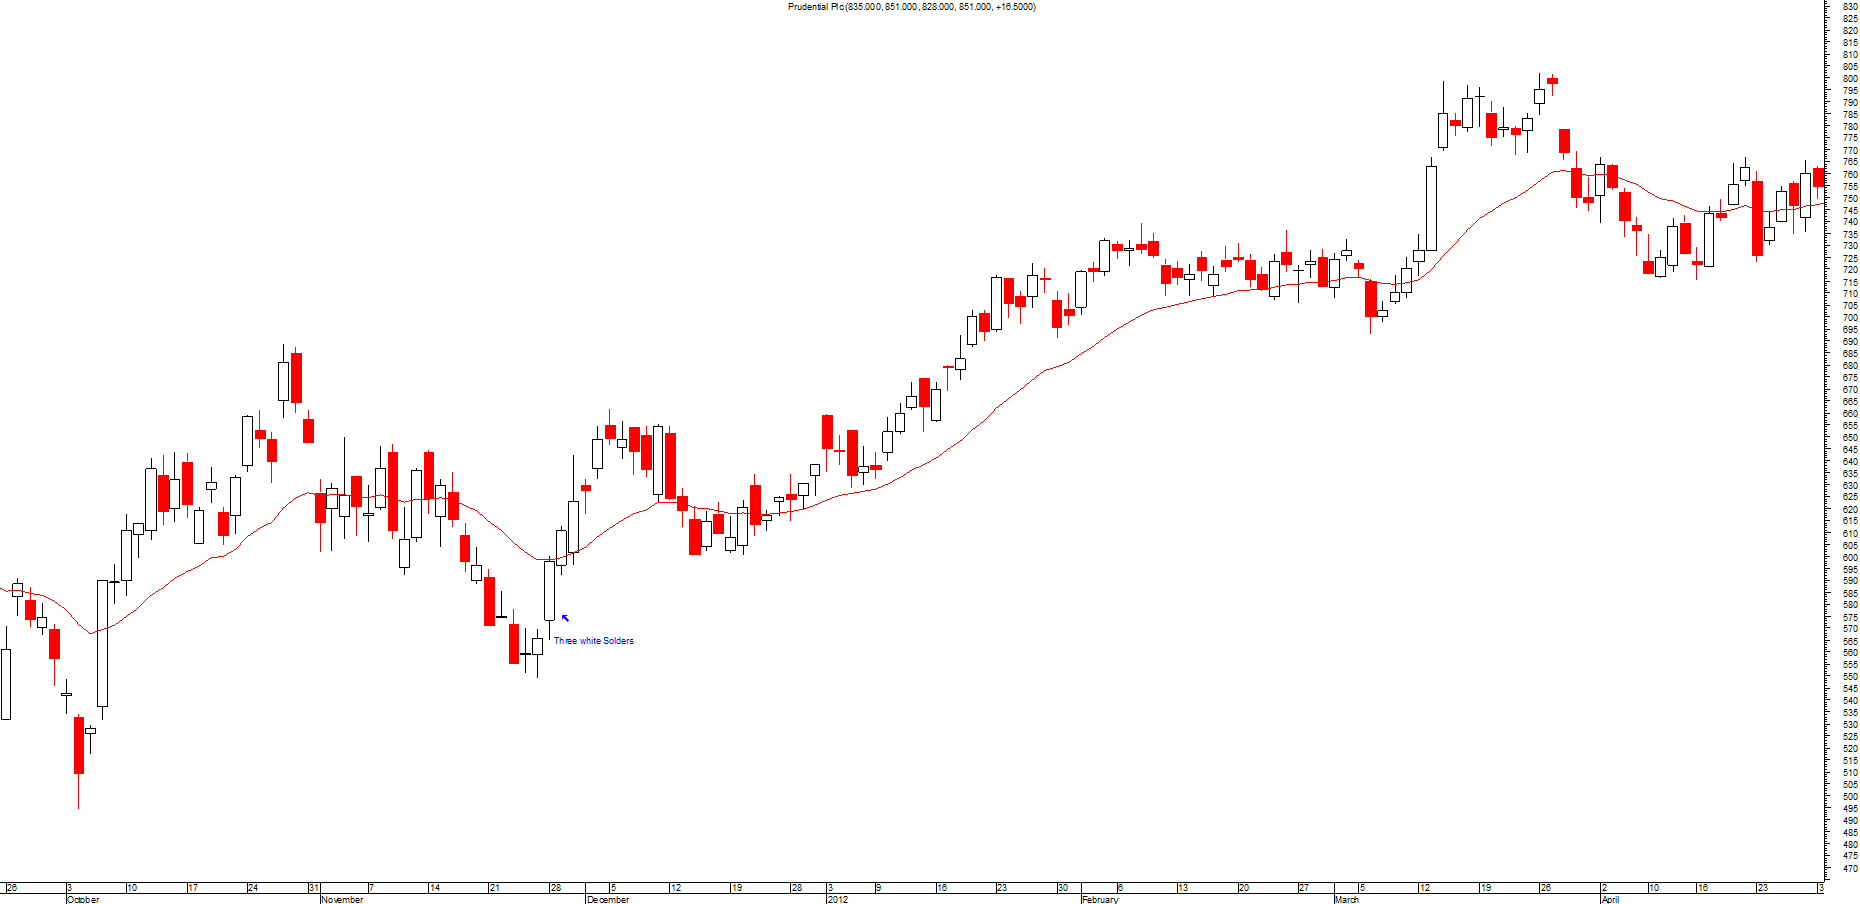
This pattern is a strong indicator of a reversal of a trend in the market. This pattern comes in a down trend and it consists of three white candles.
The opening price of each day is lower than the previous day's closing price. These white candles are formed on 3 consecutive days that have finished at a higher price than the previous day.
It is clear to see that the bulls have now taken control and the market has turned bullish.
Please click on picture above to get a larger picture
Most candlestick patterns should appear close to previous resistance or support levels depending on what type it is. You should only trade a candlestick pattern if it's near these levels.
Don't trade using these patterns if it's not at the top or bottom of a trend. These patterns appear a great deal so you have to make certain you only trade at the right level.
This is very important as you will end up over trading them and you will end up losing more money than you imagined.
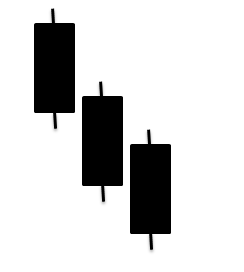
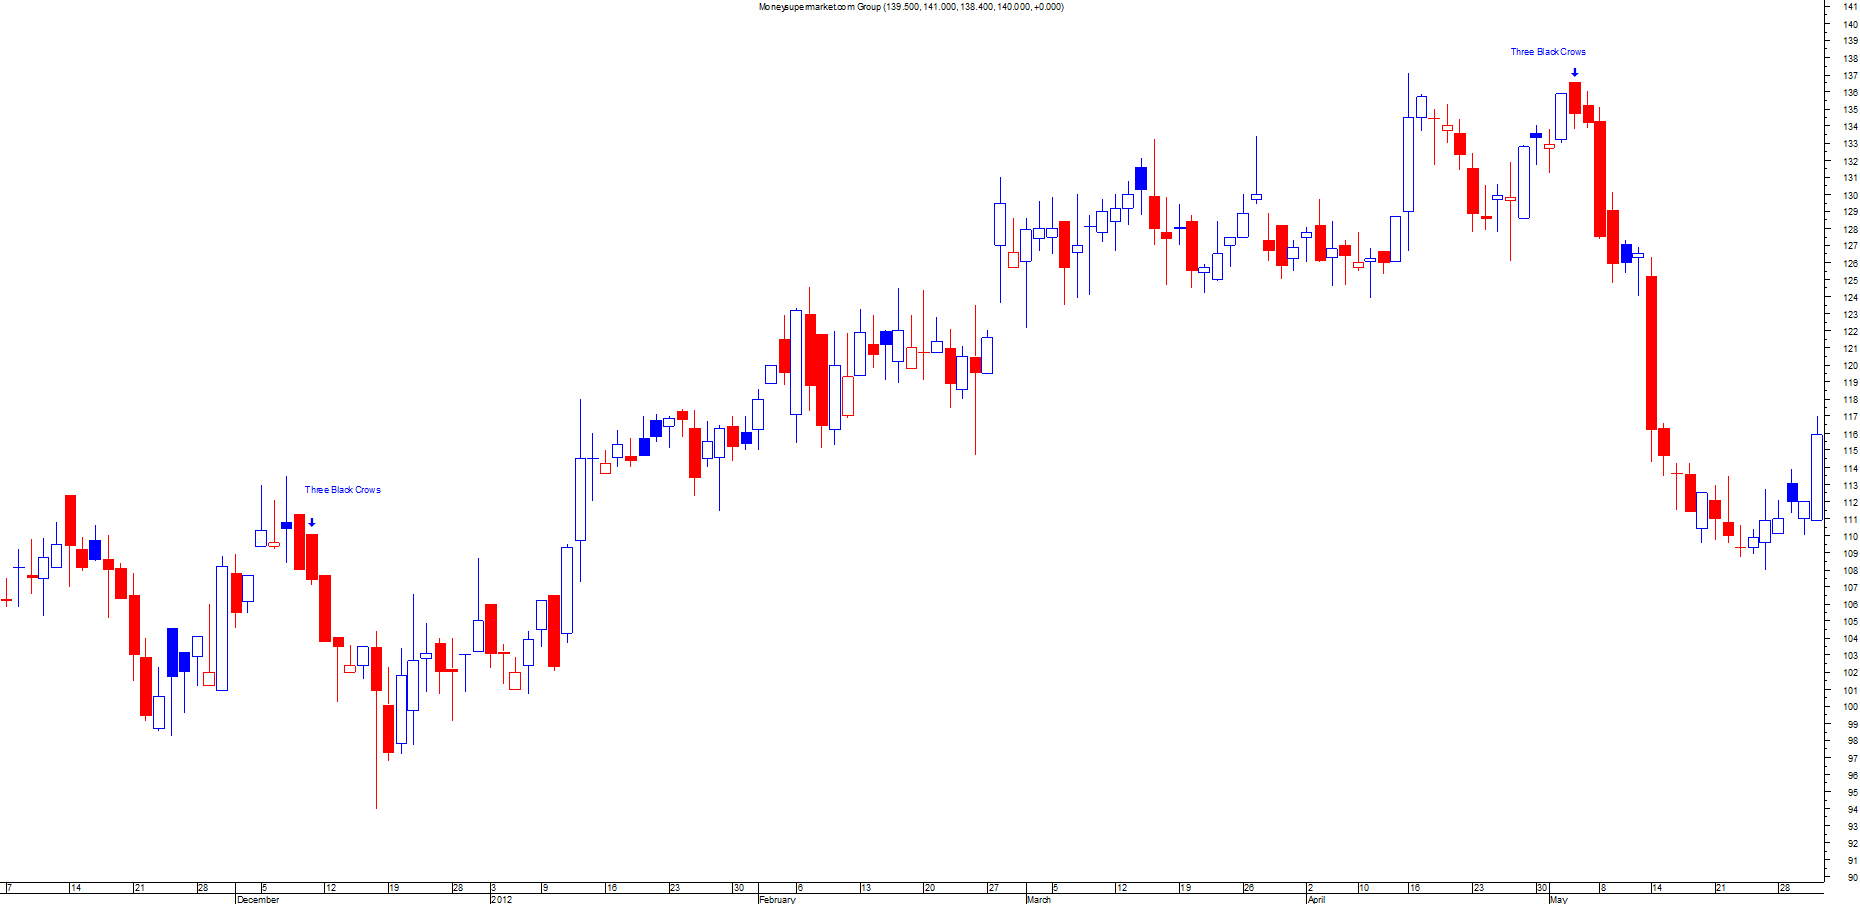
This pattern is a strong indicator of a reversal of a trend in the market. This pattern comes in an uptrend and it consists of three black candles.
The opening price of each day is higher than the previous day's closing price. These black candles are formed on 3 consecutive days that have finished at a lower price than the previous day.
It is clear to see that the bears have now taken control and the market has turned bearish.
Please click on picture above to get a larger picture
Most candlestick patterns should appear close to previous resistance or support levels depending on what type it is. You should only trade a candlestick pattern if it's near these levels.
Don't trade using these patterns if it's not at the top or bottom of a trend. These patterns appear a great deal so you have to make certain you only trade at the right level.
This is very important as you will end up over trading them and you will end up losing more money than you imagined.
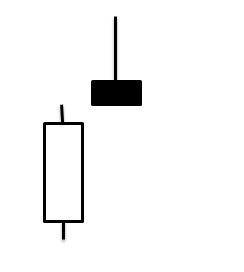
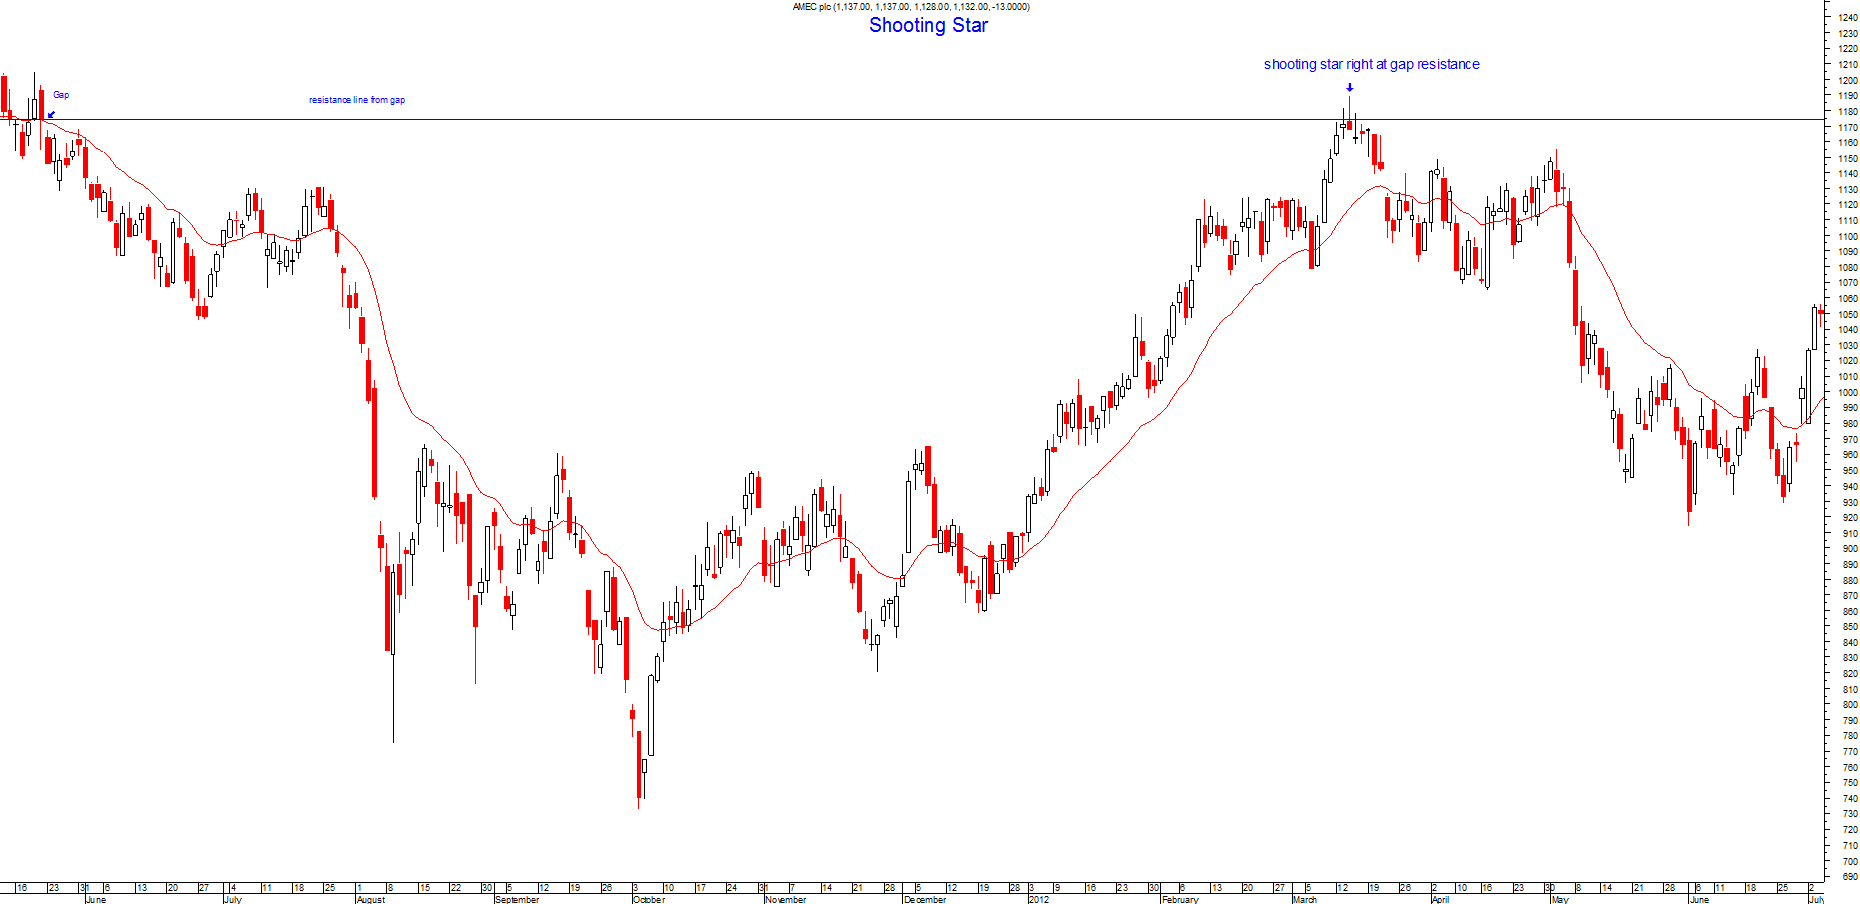
This pattern as the name suggest looks like a shooting star tumbling from the night sky, it consists of a small body were the price has closed lower than the opening price, it has a very long shadow above the body.
This pattern can be seen at the top of an up trend and signifies a reversal of a more bearish nature.
It shows that although the bulls pushed the price to a big high the bears were able to counteract and push the price all the way down to below the opening price.
However, to confirm this bearish pattern further you would need the next day also to finish on a low below the low of the shooting star.

Please click on picture above to get a larger picture
Most candlestick patterns should appear close to previous resistance or support levels depending on what type it is. You should only trade a candlestick pattern if it's near these levels.
Don't trade using these patterns if it's not at the top or bottom of a trend. These patterns appear a great deal so you have to make certain you only trade at the right level.
This is very important as you will end up over trading them and you will end up losing more money than you imagined.
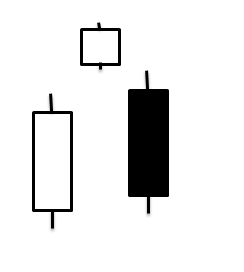
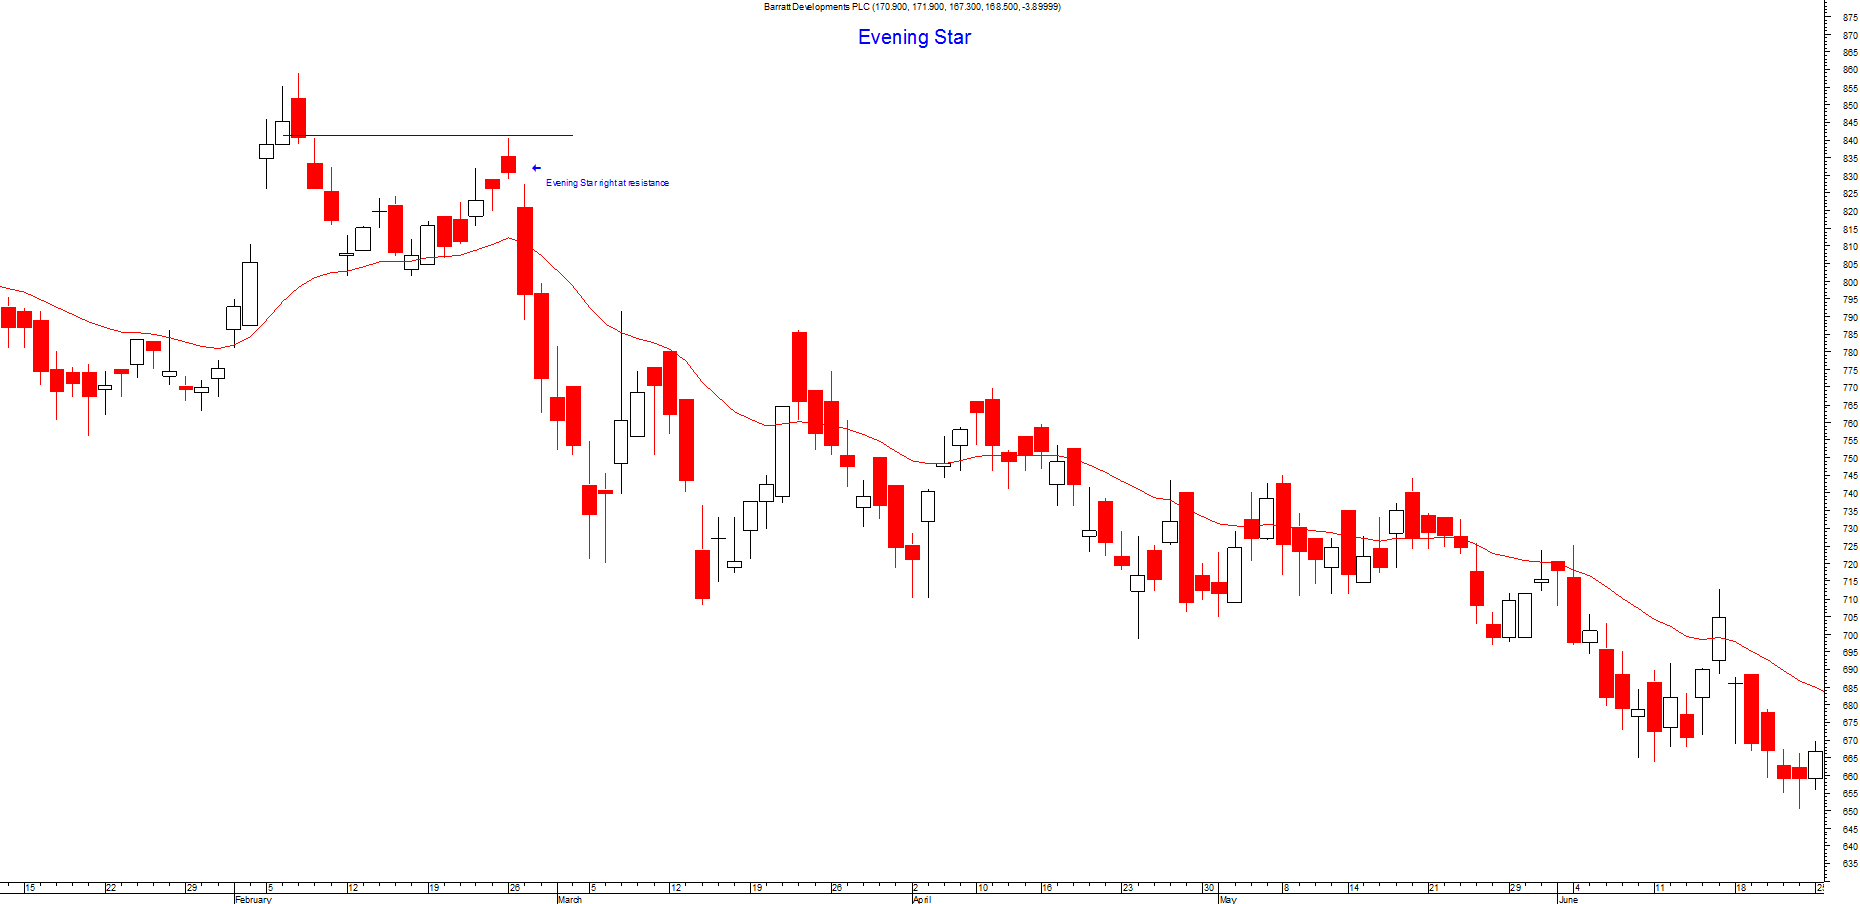
This pattern consists of three candlesticks that represent each day. This pattern is normally seen at the top of an up trend.
One white big candle represented day 1, a small white candle representing day 2 and one large black candle representing day 3.
The pattern shows the reversal of a trend during a 3 day period, it starts off with a large white candle showing that the bulls are in control and the market is very bullish, the following day it gaps up but the trend is starting to change as there is not much activity.
On the third day there is confirmation of this reversal with a large black candle signifying that the bears have taken back control from the bulls and the market is now bearish.
Please click on picture above to get a larger picture
Most candlestick patterns should appear close to previous resistance or support levels depending on what type it is. You should only trade a candlestick pattern if it's near these levels.
Don't trade using these patterns if it's not at the top or bottom of a trend. These patterns appear a great deal so you have to make certain you only trade at the right level.
This is very important as you will end up over trading them and you will end up losing more money than you imagined.
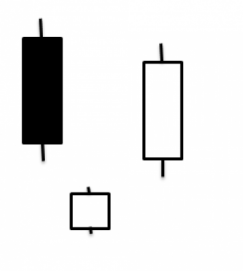
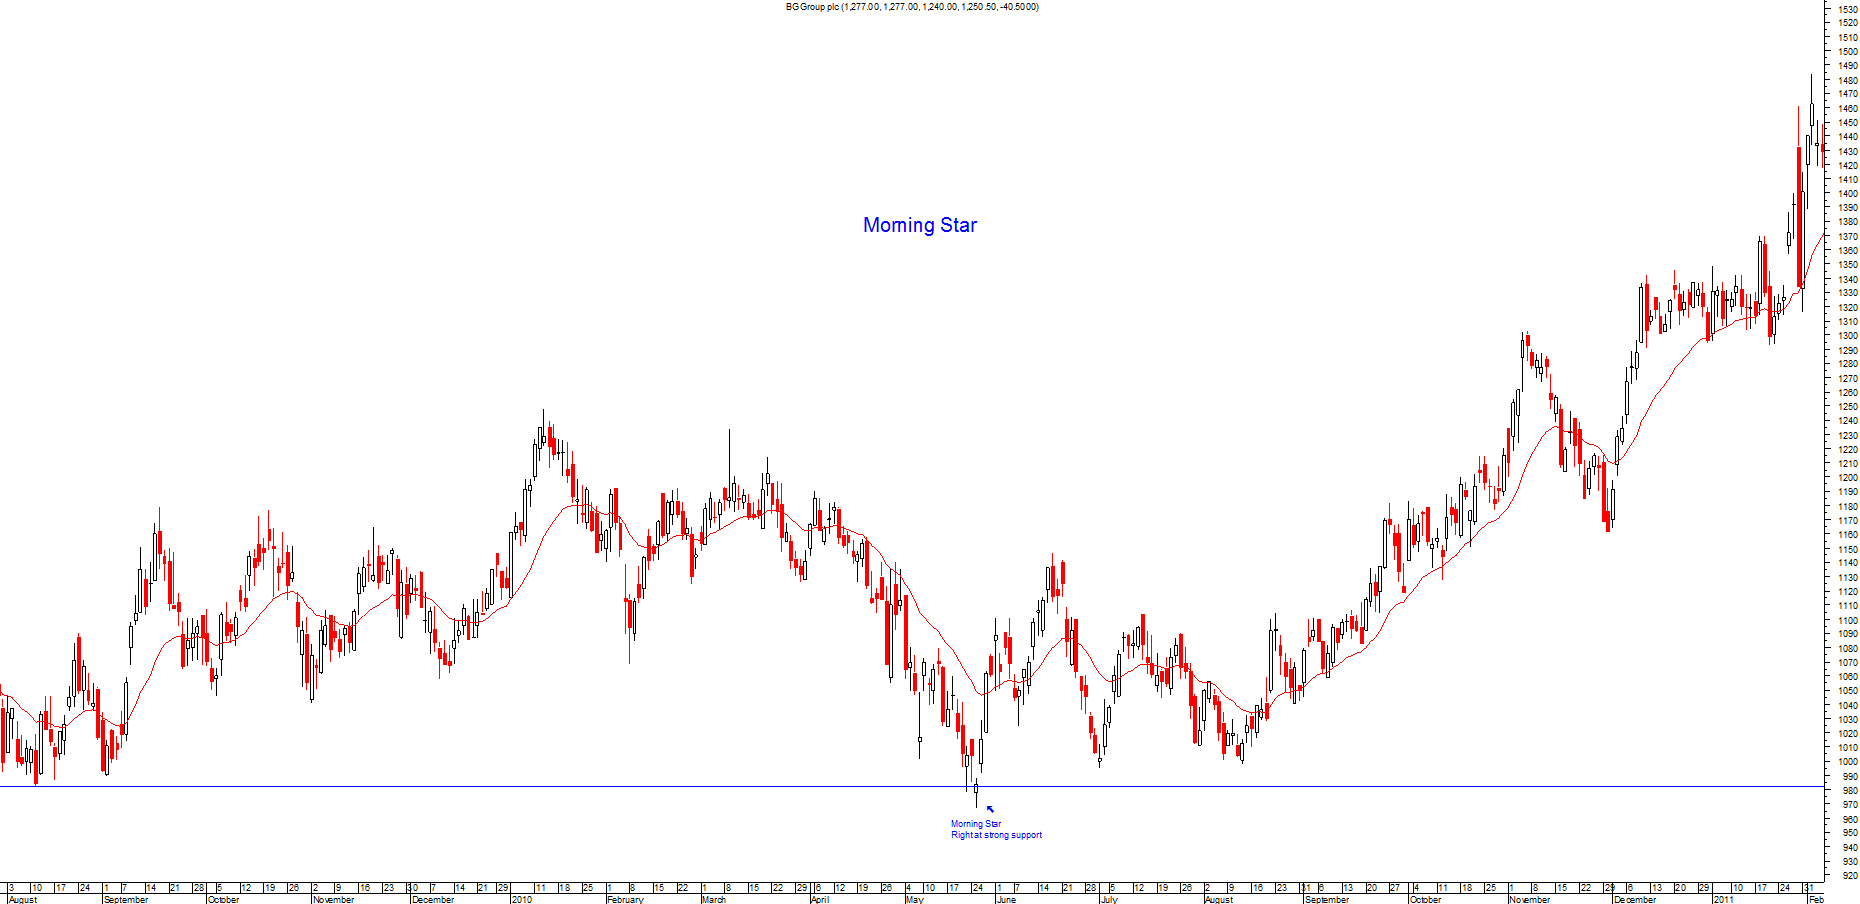
This pattern consists of three candlesticks that represent each day. This pattern is normally seen at the bottom of a down trend.
One large black candle represented day 1, a small white candle represented day 2 and one large white candle representing day 3.
The pattern shows the reversal of a trend during a 3 day period, it starts off with a large black candle showing that the bears are in control and the market is very bearish, the following day it gaps down but the trend is starting to change as it closes on a high and there is not much activity.
On the third day there is confirmation of this reversal with a large white candle signifying that the bulls have taken back control from the bears and the market is now bullish.
Please click on picture above to get a larger picture
Most candlestick patterns should appear close to previous resistance or support levels depending on what type it is. You should only trade a candlestick pattern if it's near these levels.
Don't trade using these patterns if it's not at the top or bottom of a trend. These patterns appear a great deal so you have to make certain you only trade at the right level.
This is very important as you will end up over trading them and you will end up losing more money than you imagined.
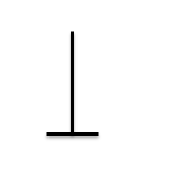
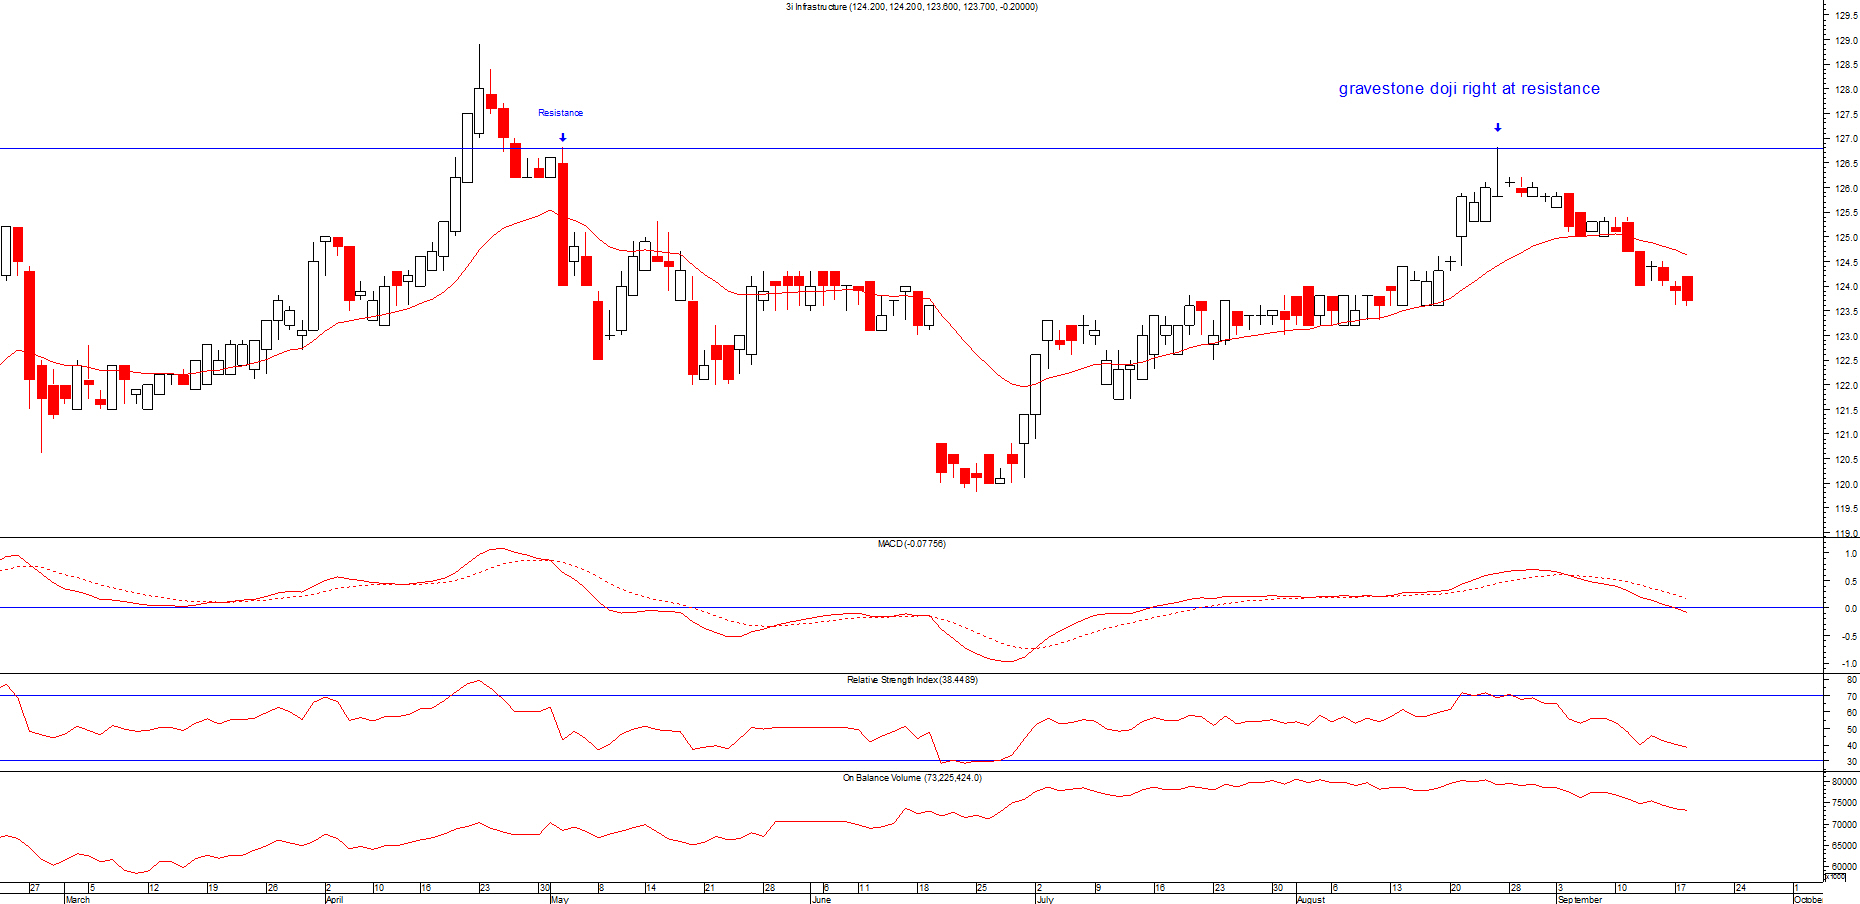
This pattern as indicated by its name is a bearish signal. It is formed when the opening, closing and the low prices are all the same on a given day.
This appears at the top of a trend. It is a bearish signal because it shows that although the bulls pushed the price to a big high, it did not stay that way.
The bears were able to drive down the price all the way to the low of the day and this is where it closed. This indicates the bears have more control than the bulls and therefore it is a bearish signal.
Please click on picture above to get a larger picture
Most candlestick patterns should appear close to previous resistance or support levels depending on what type it is. You should only trade a candlestick pattern if it's near these levels.
Don't trade using these patterns if it's not at the top or bottom of a trend. These patterns appear a great deal so you have to make certain you only trade at the right level.
This is very important as you will end up over trading them and you will end up losing more money than you imagined.
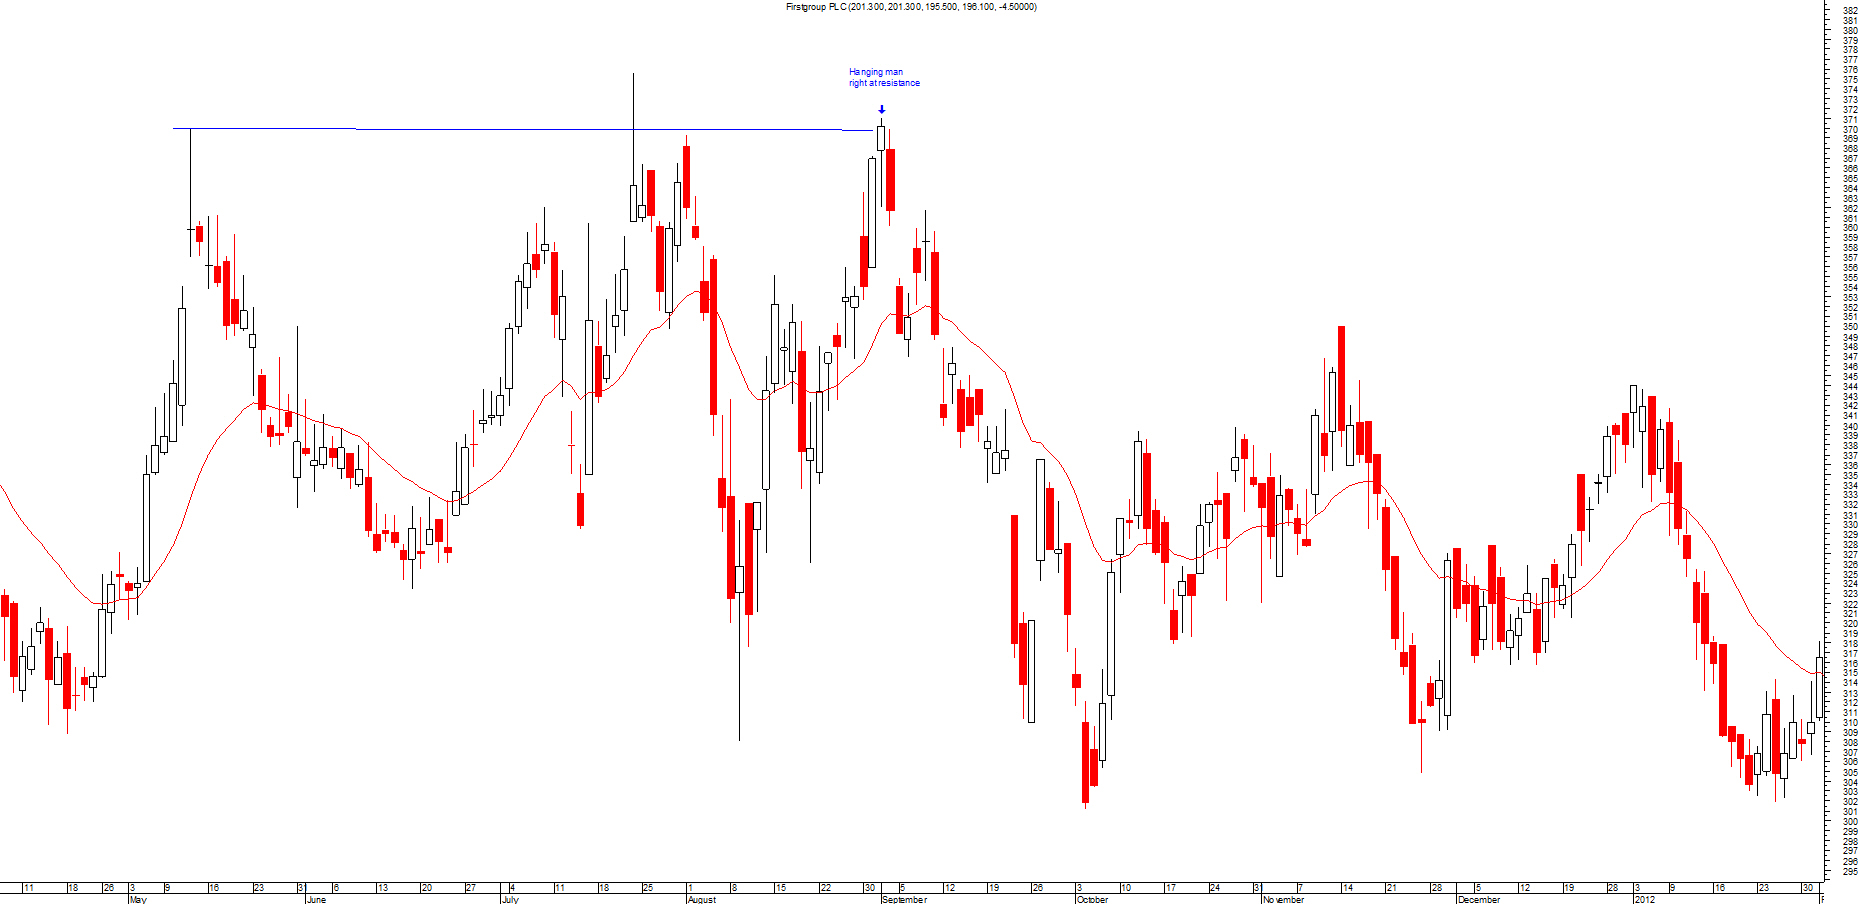
This pattern consists of a small body with a long tail or shadow below the body but no or little shadow above the body.
The long tail shows a very substantial low, which indicates that the bears are taking control(arguable). This pattern usually occurs at the top of an uptrend and could signal a reversal in the trend.
It shows that the market sentiment has change as there is more selling going on. To confirm this bearish pattern further you would need the next day also to finish on a low.

Please click on picture above to get a larger picture
Most candlestick patterns should appear close to previous resistance or support levels depending on what type it is. You should only trade a candlestick pattern if it's near these levels.
Don't trade using these patterns if it's not at the top or bottom of a trend. These patterns appear a great deal so you have to make certain you only trade at the right level.
This is very important as you will end up over trading them and you will end up losing more money than you imagined.