This is one of the most popular indicators out there if not the most, this indicator was developed by Welles Wilder.
The most used RSI is the 14 day RSI, which is the most common time frame. It's always best to use the most commonly used time frames as the more people use it the more likely it's going to work.
The RSI is:
• Plotted on a vertical scale from 0-100.
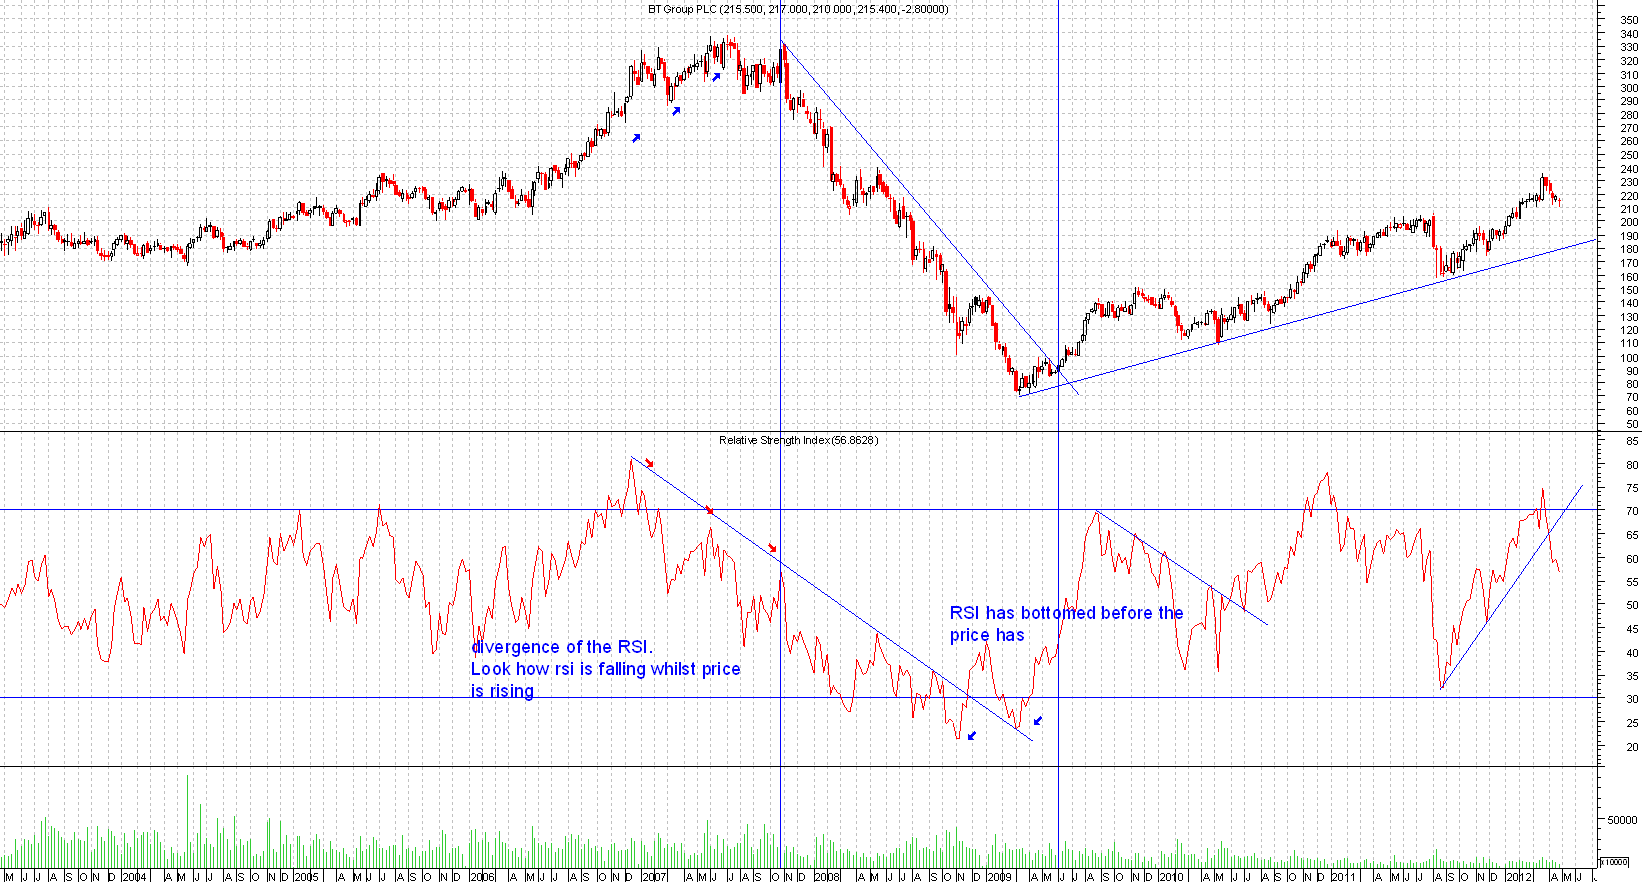
• Below 30 is oversold - So when the RSI goes below 30 you should be looking to add longs as the shares are oversold.
• Above 70 is overbought - So when the RSI goes above 70 you should not be looking to add longs but maybe take profits or even short positions.
In a strong trending market the RSI can stay above 70 for longer periods so you need to be aware of this to.
Like most indicators you can deploy trend lines to the RSI indicator and it is a good idea to look for divergence like in the example below.
Please click on chart below for larger image
This is one of the most popular indicators out there. This was first developed by Joseph Granville in his book called "Granville's New key to stock market profits".
OBV is constructed by total volume for each day as either a + or – depending on if it closes higher or lower for that day.
If it closes higher than the previous day then it's positive, when prices close lower than the previous day it's a negative.
This is added or subtracted from the cumulative total of each days volume.
Ways to look at OBV is by drawing trend lines on OBV indicator like you would on normal charts. If prices break out of the trend line then that could give you an early indication that prices may move higher.
Please click on chart below for larger image

Another common thing to look for is divergence, if prices of the stock go higher yet OBV is going lower then that would warn of lack of interest in the buyers so new positions should not be added.
See chart below for a clear divergence, this example shows that the price rose at Point B to the same level as Point A yet OBV was nowhere near the same level as it was at point A.
So in this case the divergence helped warn of lack of buyer pressure therefore a short position or profit taking could have been used at point B.
Please click on chart below for larger image

This is one of the most popular indicators out there and was developed by Gerald Appel.
This is a momentum indicator where the MACD line is made up from 2 exponentially smoothed moving averages of closing prices.
The difference between 26 and 12 day exponential moving averages. The signal line is made up of a 9 day exponential moving average.
The signals are given once the MACD crosses over the 9 day exponential moving average(signal line).
Please click on chart below for larger image

Another way to generate signals is the crossing of the Zero line from above and below.
You can also look for divergence, if the price goes to new high yet the MACD is in the overbought position (well above zero) and turns down this could forewarn of a possible top.
The same would apply for a buy signal.
Please click on chart below for larger image

Like most indicators you can draw trend lines on the MACD to help you determine possible trend changes. This can get you early entry into trades.
See chart below for XTA(Xstrata):
Please click on chart below for larger image

To be a successful trader you have to follow strict rules with regards to trading. These are some of the rules from experience:
1. DYOR stands for "Do Your Own Research". This is really important as people that just go by other peoples research are really gamblers and do not learn anything. On top of that there is no guarantee that the other person who you are following may have ulterior motives behind their tips or research.
2. Never over trade. This is so simple to do so you need to get on top of this quickly before you end up having to monitor more shares than normal. Also this could lead you to trading on a higher margin.
3. Try to limit loses to 2% of your trading capital. This is a good idea to get used to as by having a strict money management rules will mean you being in the game a lot longer. Remember it's not a race but a marathon!
For example for a 2% trade:
4. Keep emotions out of trading. Don't fall in love with a share as this will cloud your judgement.
5. If in doubt close the trade. You should be confident in your trade and if you start to doubt the trade then it's not for you.
6. Always use stops losses. This is the only way to protect and stop yourself from a accumulating a large loss. People that don't use stops can lose a great deal, these people are gamblers and will have numerous excuses to justify not having stop losses.
7. Place limit orders. This basically means you have to set your targets and take profit from this trade. This stops you from being too greedy.
8. Take some profits early. This helps you to pay yourself from trading (See 3 contract rule).
9. Keep a detailed record of every trade and the reason you entered it like a trading journal. This will give you a better picture of your trading and you can use it to learn from your mistakes.
10. Only trade when you're fully fit. So don't trade when your ill or depressed as this will affect your trading significantly.
11. Trade in the direction of the trend. They say that the "trend is your friend", so going against the trend is what gamblers would do. The odds are in your favour by trading with the trend so why go against it?
12. Never be too greedy.
13. Buy at support and sell at resistance.
14. Never chase a share, let it come to you.
15. Place your trades by limit orders(if possible), I place my limit trades after the market is open and close them at the end of the day,This will protect you from the gap downs or gap ups and this way you don't have to watch the screen all day long. This will also cut the emotions out of placing a trade.
16. Have a decent trading capital to start trading with, ideally around £10000 is the bear minimum as this will allow you to have 50 trading losses. People with less starting capital tend to break the 2% rule of trading so your starting capital is important for you not to risk to much on any trade.
17. Invest in a decent real time software if your day trading, as delayed charts simply are not accurate enough. If you're an end of day trader then use end of day charts from a decent company like MetaStock for example, which is what is used for all the chart examples on this site. It's only worth investing in a decent software once you understand charts so that you can get the most out of it.
18. Stops should only be moved once it moves in your favour. Only move the stop in the direction of your trade and not further away. They are there to protect you so don't go moving them in the wrong direction once the trade has started.
19. Always look at more than one time frame.
This is when prices have been falling hard then all of a sudden prices re-bound the following day.
This could leave gaps in the open of the next day trading, these are normally caused by big market news.
Please click on chart below for larger image
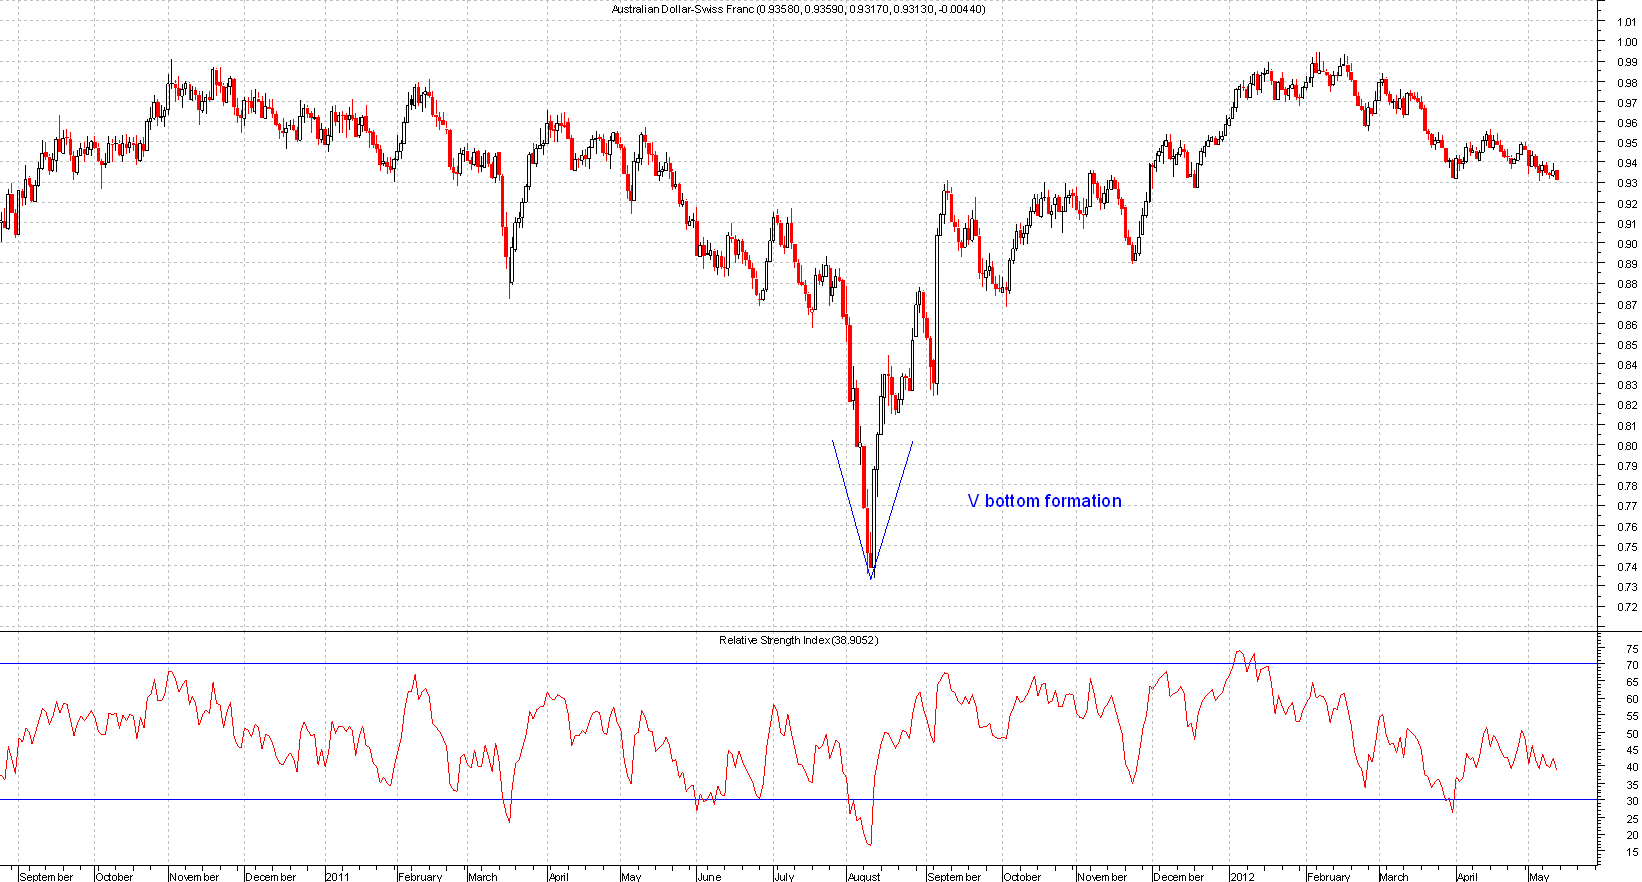
These are quite hard to trade due to the speed of the moves therefore you should normally look for a higher high before entering.
These are also very volatile so it is best to wait for a clear signal or a better entry from a pull back.
This is a very rare pattern and does not happen that often, the share price rises to roughly the same area of resistance three times creating three peaks.
It does not have to be the perfect level of each other as long as its roughly near the peaks.
The signal completes when the price goes below the supports of the 2 lows that were created in the process that led to the triple top.
The volume goes down on each peak and the volume increases once the supports breaks preceding the triple top.
This chart is of the Dow Jones Industrials.
Please click on chart below for larger image
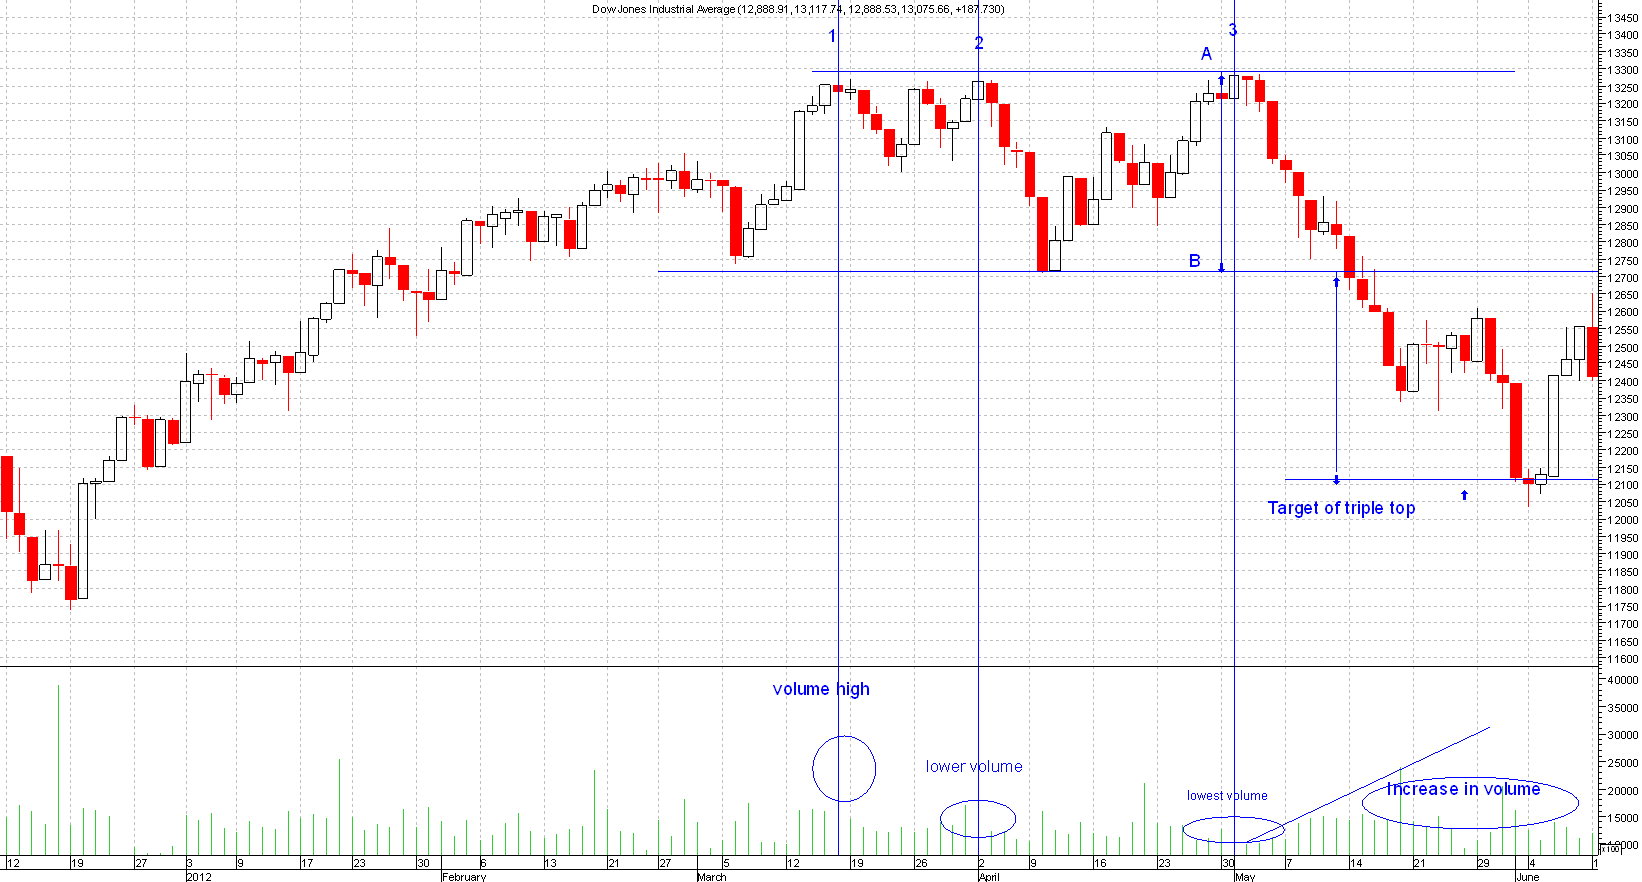
These patterns are usually formed and appear only after an uptrend.
You have to take the peak(point A) and the lower supports(point B) as in the chart above and extend that length from the breakout point to have your targets.
As can be seen from the chart above it was a perfect trade as this generated 600 points profit.
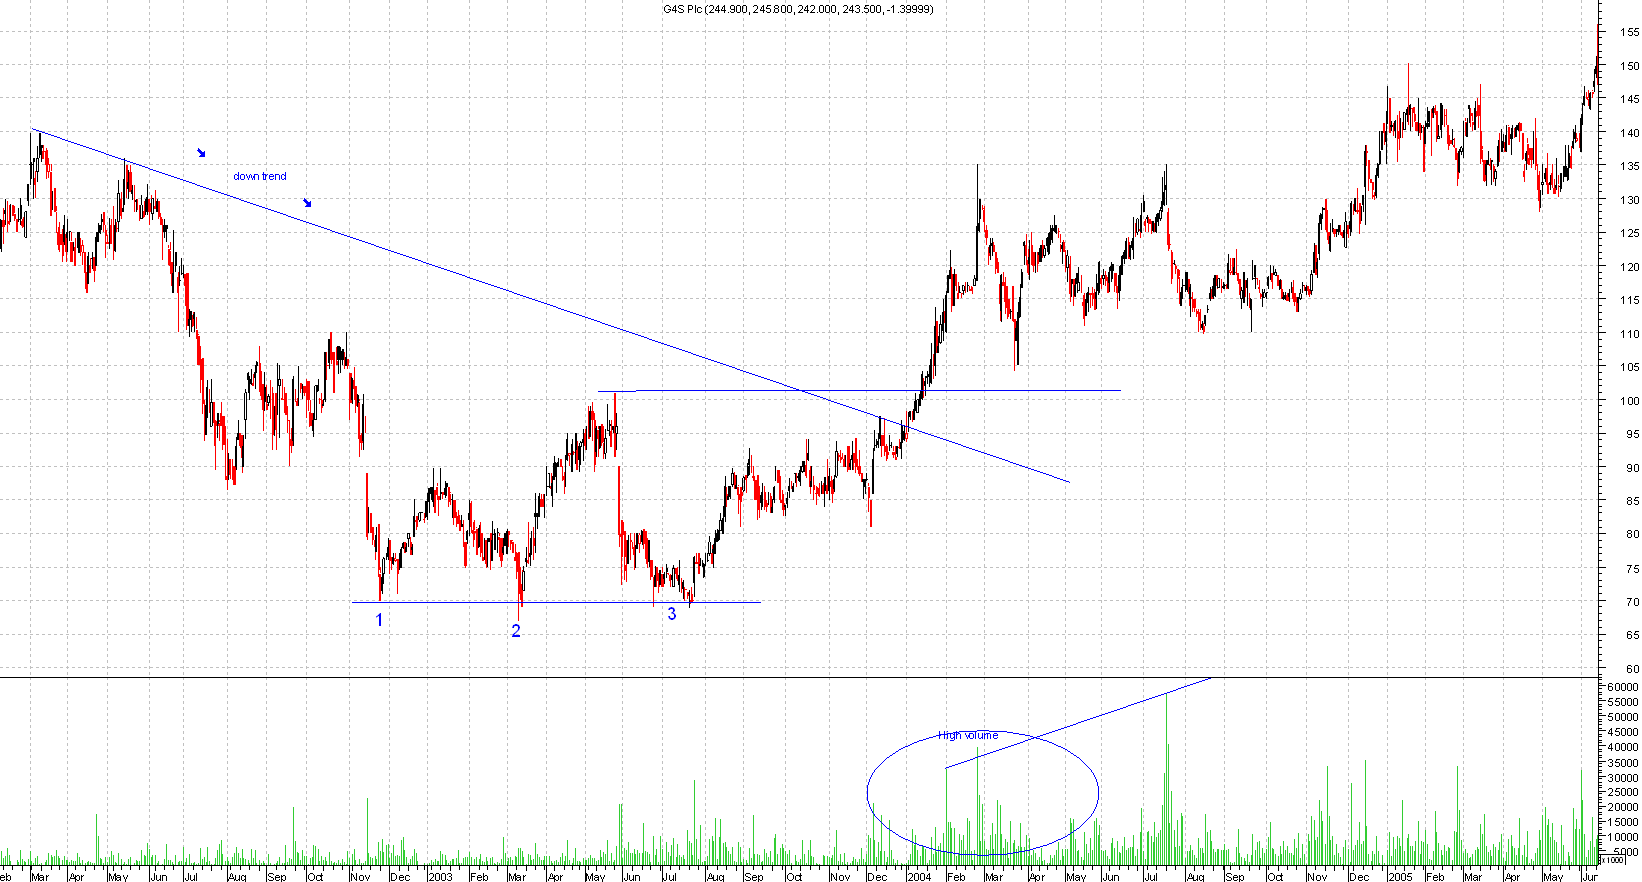
This is the opposite of the triple top pattern(see triple top article).
The share price bounces of roughly the same low three times and once the peak resistance is broken then you get the buy signal, which should be followed by high volume.
Please click on chat below for larger image