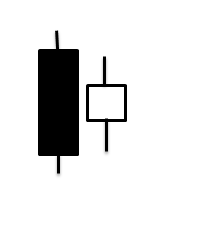
A bullish harami is a two-candle pattern that can appear at the end of a downtrend. A large bearish candle is followed by a small candle whose body sits completely inside the first one. It shows that selling has suddenly slowed down. It is an early warning that the trend may turn, not a buy signal on its own.
What a bullish harami looks like
- Candle one: a long bearish (red or black) candle, in line with the downtrend.
- Candle two: a small candle, usually bullish, whose body sits entirely within the body of candle one.
Harami is an old Japanese word for pregnant: the small candle looks like it is being carried by the big one. When the second candle is a doji, the pattern is called a bullish harami cross and is seen as a slightly stronger signal.
In shares, the second candle often opens with a gap up inside the first body. In markets that trade around the clock, such as forex, gaps are rare, so you judge the pattern on the bodies alone.
What it tells you
After a strong bearish day, you would expect more selling. Instead, the next session stays inside the previous range and closes higher than it opened. Sellers have lost momentum, and buyers are starting to push back. That is all it says. It does not show buyers are now in control.
How to trade a bullish harami
- Wait for confirmation: look for the next candle to close above the high of the harami pair, or above the top of the first candle's body.
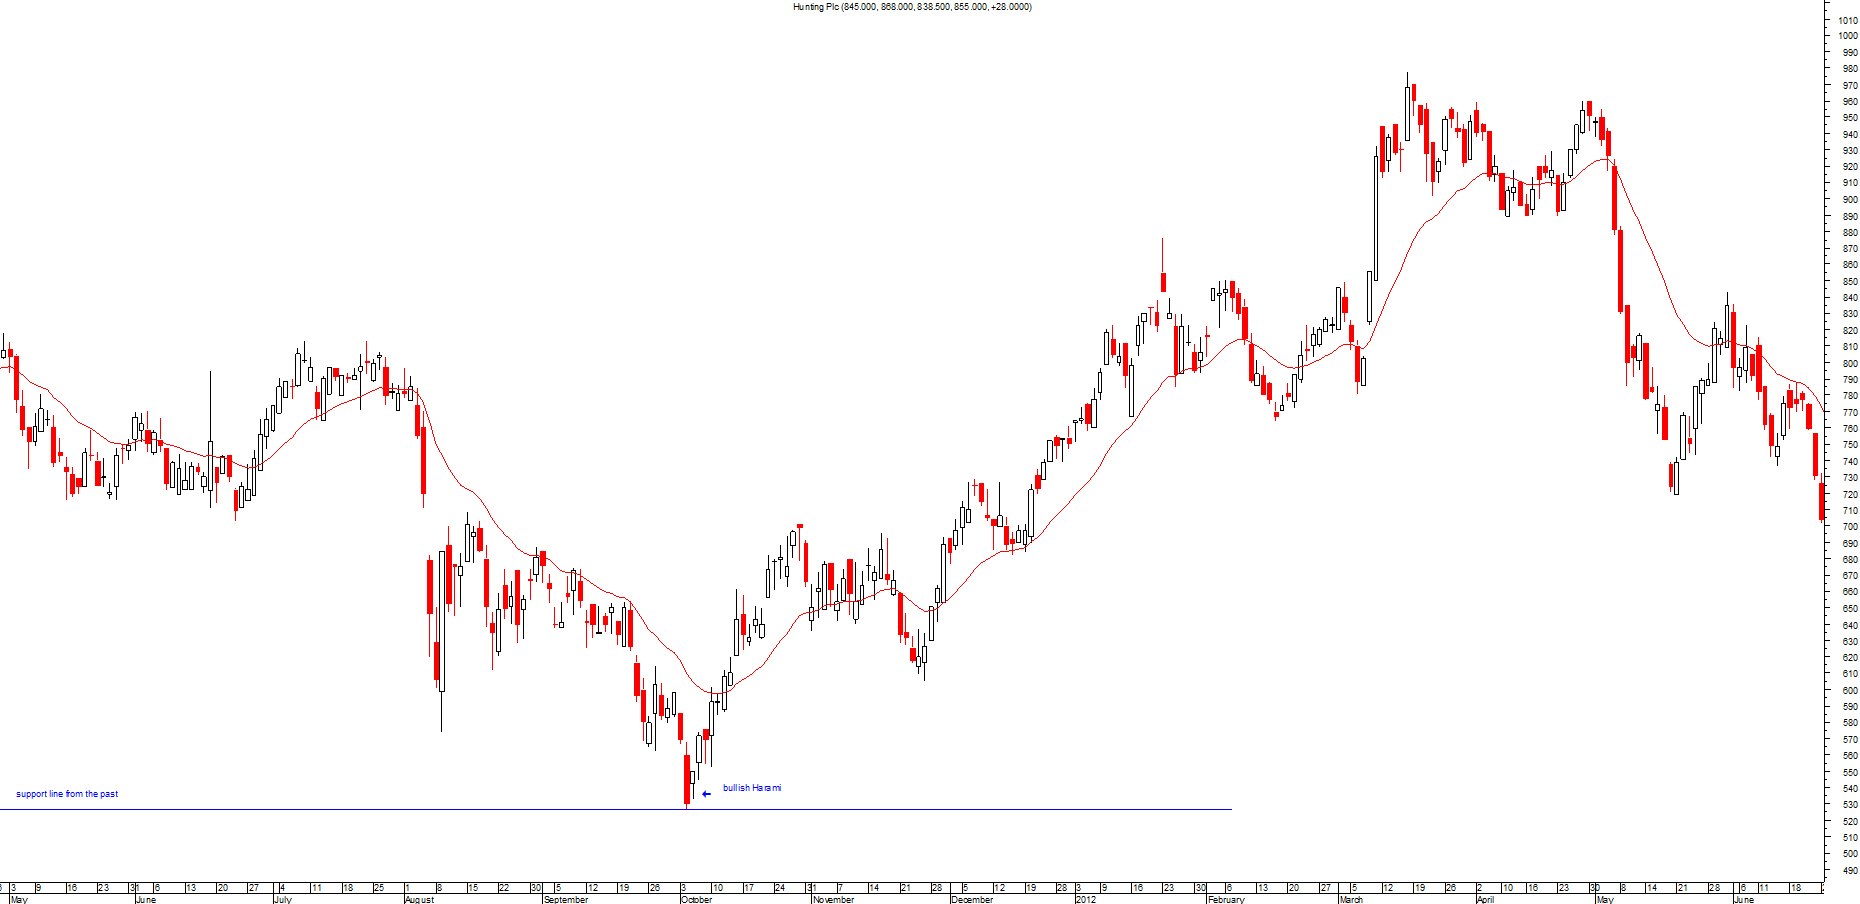
- Check the location: the pattern is far more useful at support, a rising trend line or after a long decline.
- Stop: below the low of the two candles.
- Target: the nearest resistance level, or use a risk-reward ratio of at least 2 to 1.
A candle pattern on its own is weak evidence. It matters most when it forms at a level that already matters, such as support, resistance, a trend line or a moving average, and when the next candle confirms it.
Bullish harami vs bullish engulfing
They are opposites in shape. In a harami, the second candle is small and sits inside the first. In a bullish engulfing pattern, the second candle is large and wraps around the first. Engulfing patterns are generally seen as the stronger signal.
Related guides
- Bearish harami
- Engulfing patterns
- Essential candlestick patterns
- Doji patterns
- Support and resistance zones
This guide is for education only and is not financial advice. Trading carries risk; you can lose more than you expect.