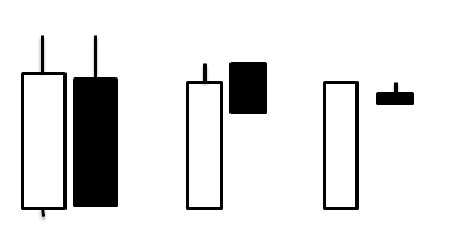
A tweezer top is two candles in a row with highs at almost exactly the same price, forming at the top of a rally. The matching highs show the market tried the same level twice and was pushed back both times. It can be an early sign that an uptrend is running out of buyers.
What a tweezer top looks like
- Candle one: usually a bullish candle that continues the rally.
- Candle two: usually a bearish candle whose high matches the first candle's high, or comes very close.
The two highs line up like the tips of a pair of tweezers, which gives the pattern its name. The highs can be the tops of the wicks or the tops of the bodies; what matters is that the market hit the same ceiling twice and failed.
On a weekly chart, the same idea can stretch over two weeks. On an intraday chart, it can form in minutes.
What it tells you
On day one, buyers push the price up. On day two, they try again at the same level, but sellers are waiting. The price falls back and closes lower. That shows a clear level where supply beats demand.
How to trade a tweezer top
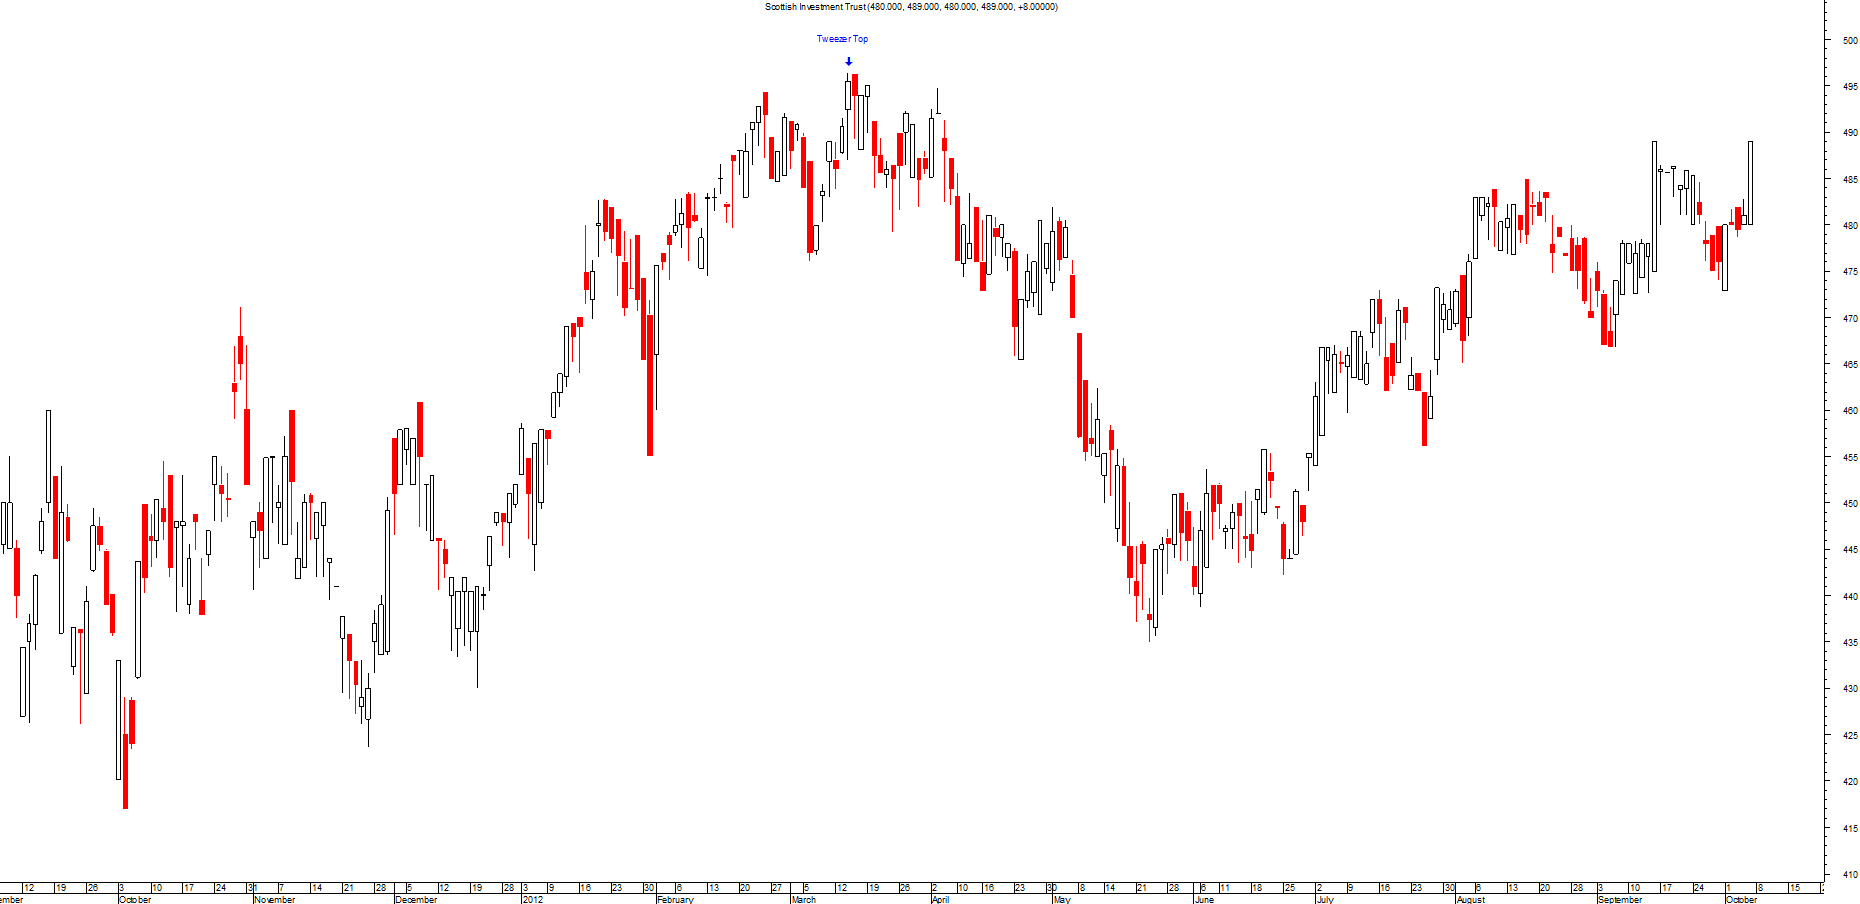
- Confirmation: wait for the next candle to close below the low of the second candle.
- Location: look for it at known resistance, a previous high or the top of a channel.
- Stop for shorts: just above the matching highs.
- Target: the nearest support, or a fixed risk-reward ratio such as 2 to 1.
A candle pattern on its own is weak evidence. It matters most when it forms at a level that already matters, such as support, resistance, a trend line or a moving average, and when the next candle confirms it.
Mistakes to avoid
- Treating any two equal highs as a signal. In a quiet market, equal highs happen all the time.
- Ignoring the trend. A tweezer top in the middle of a strong uptrend often turns out to be a short pause.
- Not using a stop. If the price breaks above the matching highs, the pattern has failed.
Related guides
- Tweezer bottom
- Bearish harami
- Essential candlestick patterns
- Engulfing patterns
- Support and resistance zones
This guide is for education only and is not financial advice. Trading carries risk; you can lose more than you expect.