A trend line is a straight line that joins a series of lows in an uptrend, or a series of highs in a downtrend. It is one of the simplest tools in technical analysis and one of the most useful. A good trend line shows you the direction of the trend, where pullbacks might stop and when the trend may be ending.
How to draw a trend line
- Uptrend: join two or more rising lows with a straight line. The line sits under the price.
- Downtrend: join two or more falling highs with a straight line. The line sits above the price.
- Use the extremes: the lowest lows in an uptrend and the highest highs in a downtrend. Some traders use candle bodies instead of wicks; either is fine if you are consistent.
- Two points make a line, but a third touch is what makes it valid. The more touches, the more people are watching it.
Do not force a line through prices to make it fit. If you have to cut through several candles to make it work, it is not a good trend line.
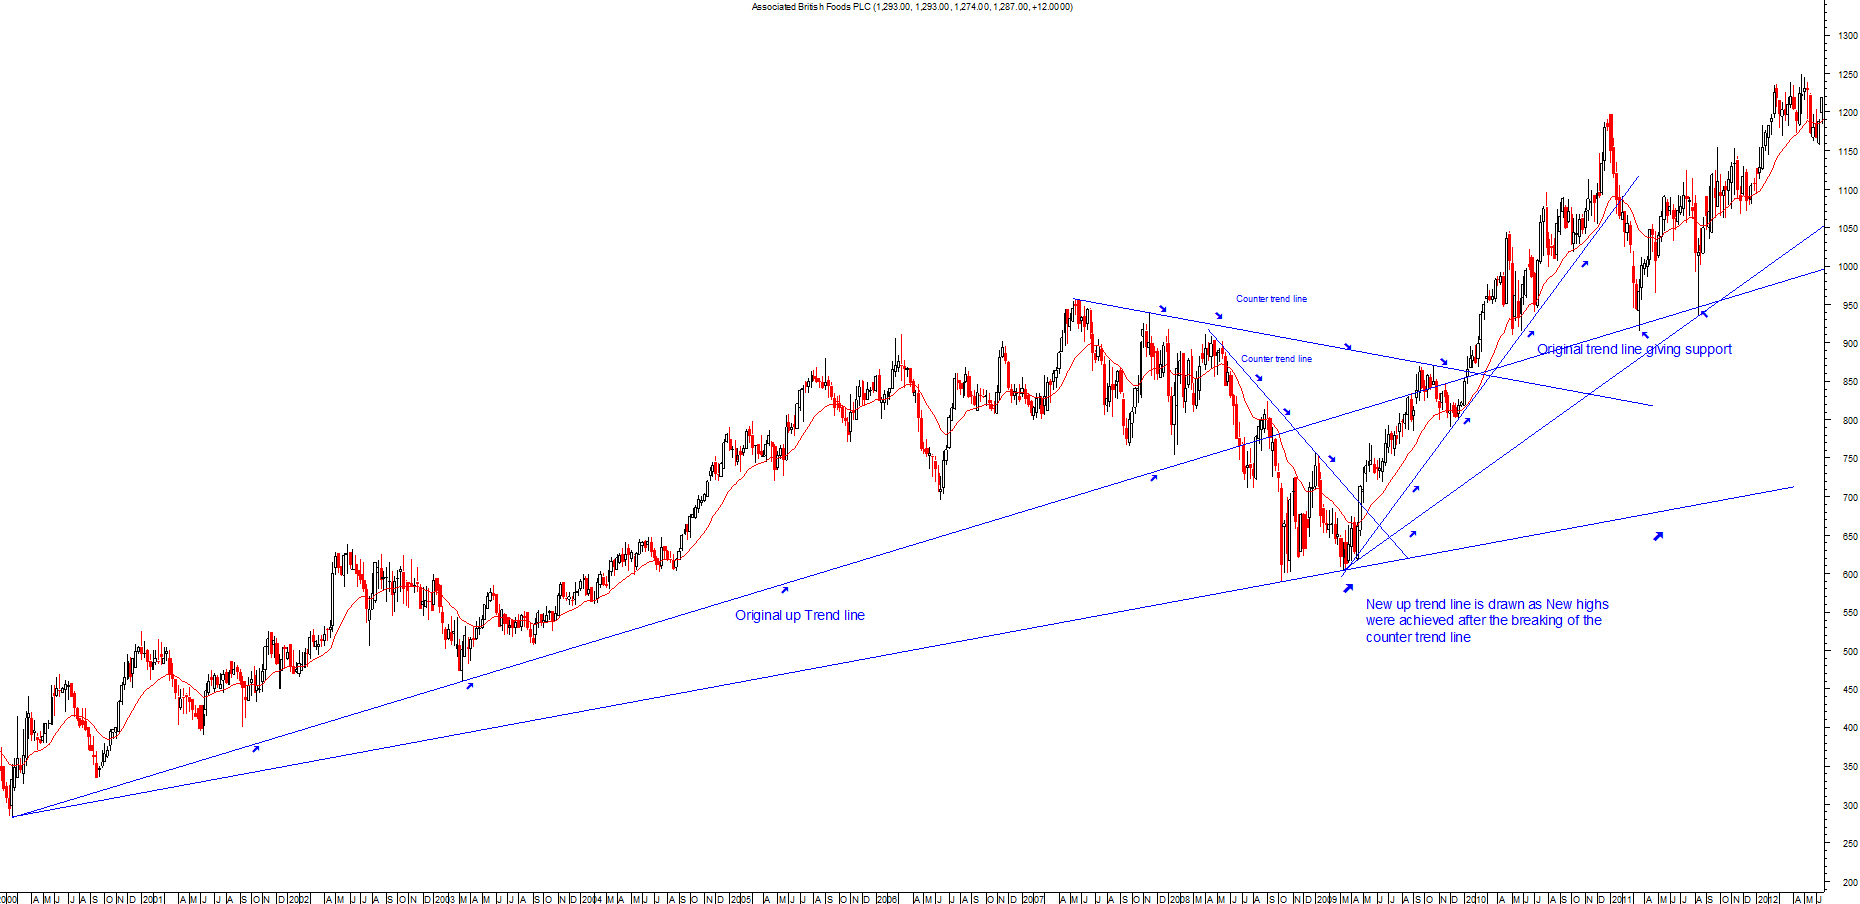
How important is a trend line?
- Length: a trend line that has held for a year matters more than one that has held for a few weeks.
- Touches: more touches mean more traders are aware of it.
- Angle: very steep trend lines break easily. A gentle slope is more sustainable.
- Timeframe: lines on weekly charts carry more weight than lines on hourly charts.
Big trends often contain smaller counter-trends lasting weeks or months. Drawing lines on more than one timeframe helps you see where you are in the bigger picture.
Trading with trend lines
- Buy the dips: in an uptrend, a pullback to the trend line is often a good place to look for a buy, with a stop just below the line.
- Sell the rallies: in a downtrend, a rally back to the line is a place to look for a sell or to exit longs.
- Look for confirmation: a bullish candle at the line, or a bounce on rising volume, adds weight.
Trend line breaks
For a break to count, many traders want a close beyond the line, not just an intraday poke through it. A break on high volume is more convincing.
After a break, the old line often switches roles: a broken uptrend line can become resistance when the price comes back up to it. A break does not always mean the trend has reversed. It can simply mean the trend is slowing or moving sideways. Look at market structure, such as a lower high after the break, to judge whether the trend has really changed.
Related guides
This guide is for education only and is not financial advice. Trading carries risk; you can lose more than you expect.