This pattern is similar to the rounded bottom, the only difference is once the rounded bottom is complete you then find the price retreats a little then goes sideways then goes up again.
This creates the handle, the buy signal comes when the resistance is broken, the point where the peaks are joined together and formed the cup and handle.
The target is taken from the bottom to the top which then is projected from the break out point.
Please click on the chart below for larger image

This is often taken from the original trend line(copy) and added to the peaks(top line), once you have 2 peaks then a channel may exist and you can use it to good use.
The channel in an uptrend is projected up and vice versa for a downtrend, channel lines can be used for short term trading.
This is a chart for Marks and Spencer and the channel line can be easily seen. This is in a clear downtrend so you would short at the top of the channel, stops could be placed above the previous peaks.
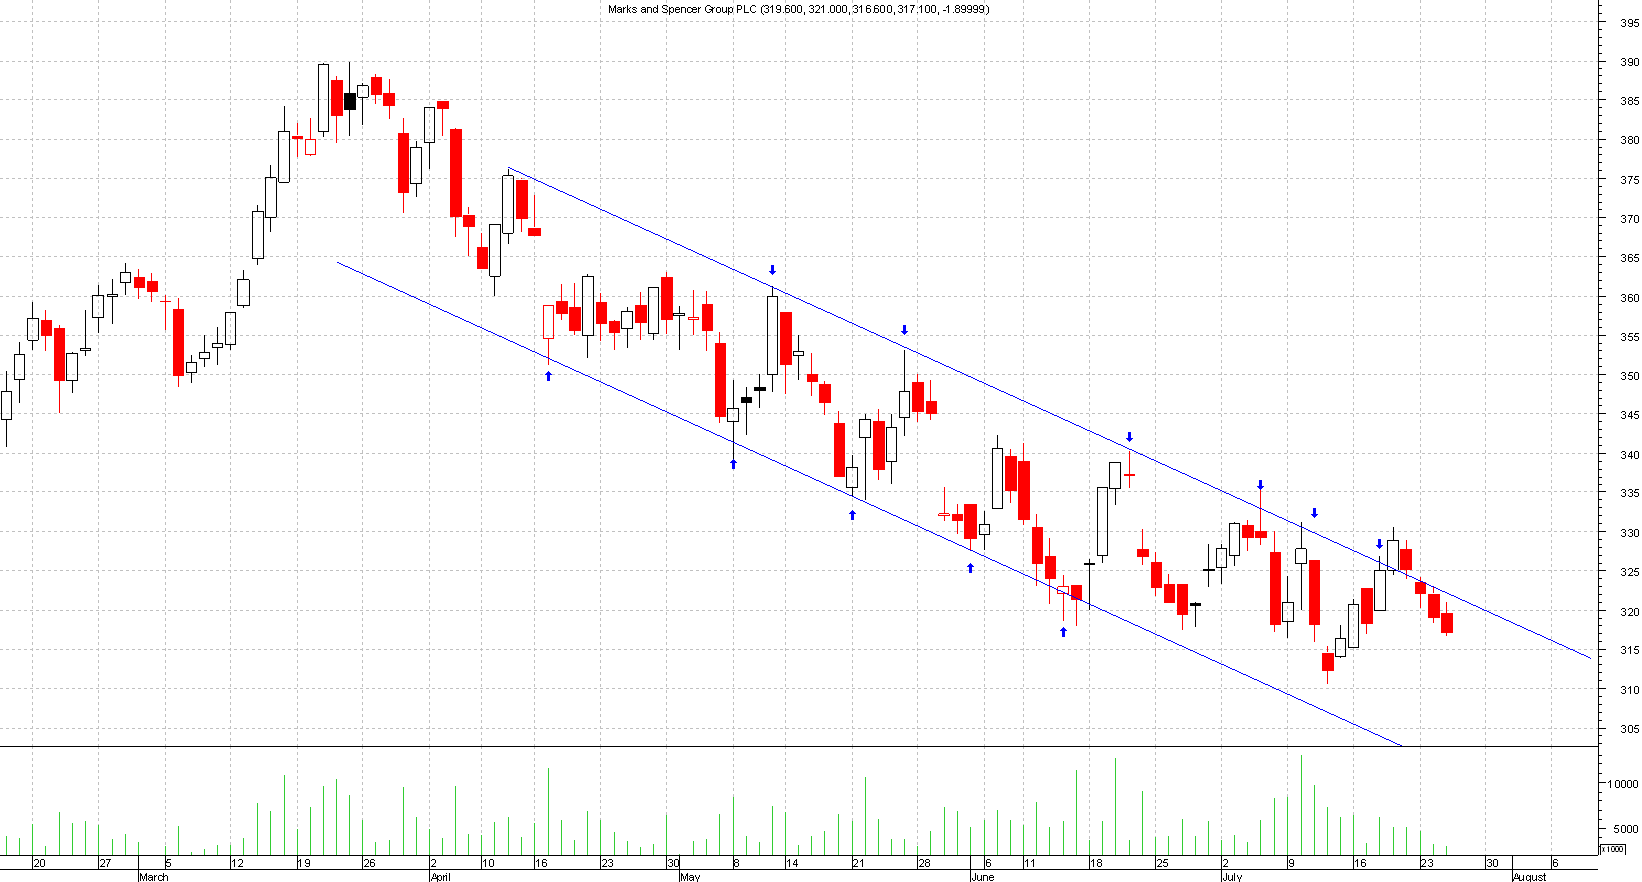
Once you have a channel line it's possible to set targets. Once a clear channel is established and a break out occurs then you can roughly guess the targets of the breakouts.
This is done by measuring the width of the channel and adding this to the breakout point.
1. Never trade on all candlestick signals. This is important as trying to trade most signals is the quickest way to lose money. Not all candlestick signals should be used to buy or sell. You should consider the risk /reward aspect of the trade beforehand and also where the candles appear.
2. Doji should only be respected if it's in a trend(up or down). If it's in a middle of a box range then you would ignore this. This is true of all candlestick patterns.
3. Candlestick patterns can be used on all time frames.
4. Once you get a bullish engulfing pattern then this level should be used as support in the future. Same can be said for any major reversal pattern.
5. Aggressive traders can go long when the price retreats half way down the bullish engulfing pattern. Stops would be below the bullish engulfing pattern.
6. All major signals should form near known resistance or supports. The odds are better for a successful trade. This is the most important thing when using candlestick charts.
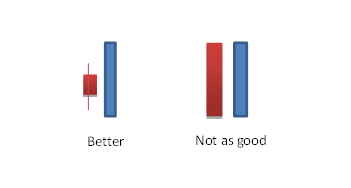
7. Small real bodies imply that the preceding trend momentum is slowing.
8. It's best to have a small real body than a big bullish engulfing pattern rather than equal size candles.
9. If you enter a trade on a Gap up, for example a island reversal but during the day the gap got filled then you should close out the trade. This is because the reason behind the trade is now no longer valid i.e. Gap got filled so it's not an island reversal.
10. If a share falls hard on a daily chart for 8-10 sessions then this could be considered oversold. If you then looked at the hourly chart and it's been going sideways then this may not be oversold anymore due to the sideways move. Sideways move actually eases the oversold or over bought conditions.
11. Gaps are called windows in candlesticks. Once the top window gets broken in a bull market then the bears may now be in control.
12. In a bull market you may get a few windows whilst the price moves up.
13. When the market gaps above a major resistance level then this could be worth going long.
14. Always use western technicals with candlesticks. They work perfectly together.
15. In an uptrend when the price reverses and heads to a previous gap up then it could be worth adding longs on the fill of the gap. Only do this on the first attempt.
16. At the extremes of known resistances, if this level has been touched more than 2 times in the past and reversed, then it could be worth going short the next time it reaches the same level. Only do this on the first attempt during that day and not on the second attempt.
123 High is a method that is used to find possible tops in charts. The way this works is, that it's looking for an end to the higher highs.
This method is a very popular method and is used to find bottoms. The way it works is, that it's looking for the end to the lower lows,
so basically waiting for the first higher highs to form.
This is best used in a down trend only, the way to draw this is that you need a low point on the chart.
Then you wait for the price to move higher at which point you label it 1, then you wait for a retrace which should not go below the low.This you label 2
If it breaks below the low then you would have to start again. You still would not have an entry so you have lost nothing at this point.
If it does not go below the low but starts to move higher from here then you can label it 2. Now the buy signal comes once the price goes above the high of label 1, by doing so you have also got yourself a higher high.
Obviously this can be very confusing so best to look at the chart below for example:
Stops should be placed below label 2, the target could be the distance from top of 1 to the bottom of 2, which then can be projected from the breakout point.
So that is the level where you could take profits from but the bigger picture could be the fact that you may have found a possible bottom to the share so leave some positions on still.
You can get a few false signals and the best way around this is to use an indicator with it. The common indicator used is a Macd indicator and if this also has a buy signal then that gives the 123 low added confirmation.

Please click on the chart below for larger image

A trend has three directions:
Uptrend:
Downtrend:
Sideways Trend:
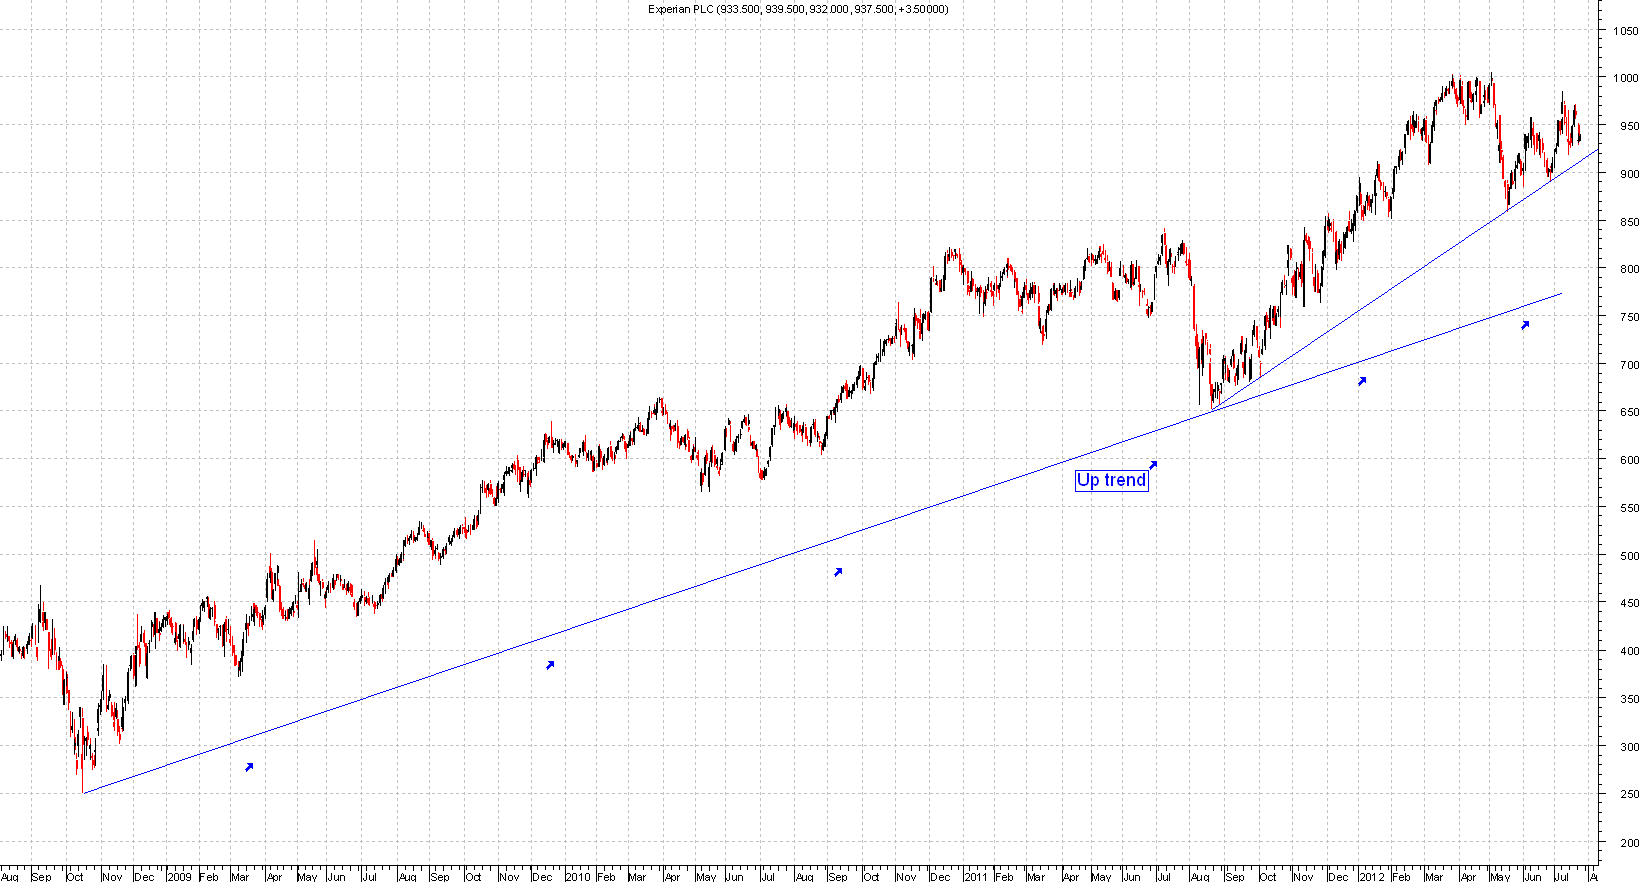
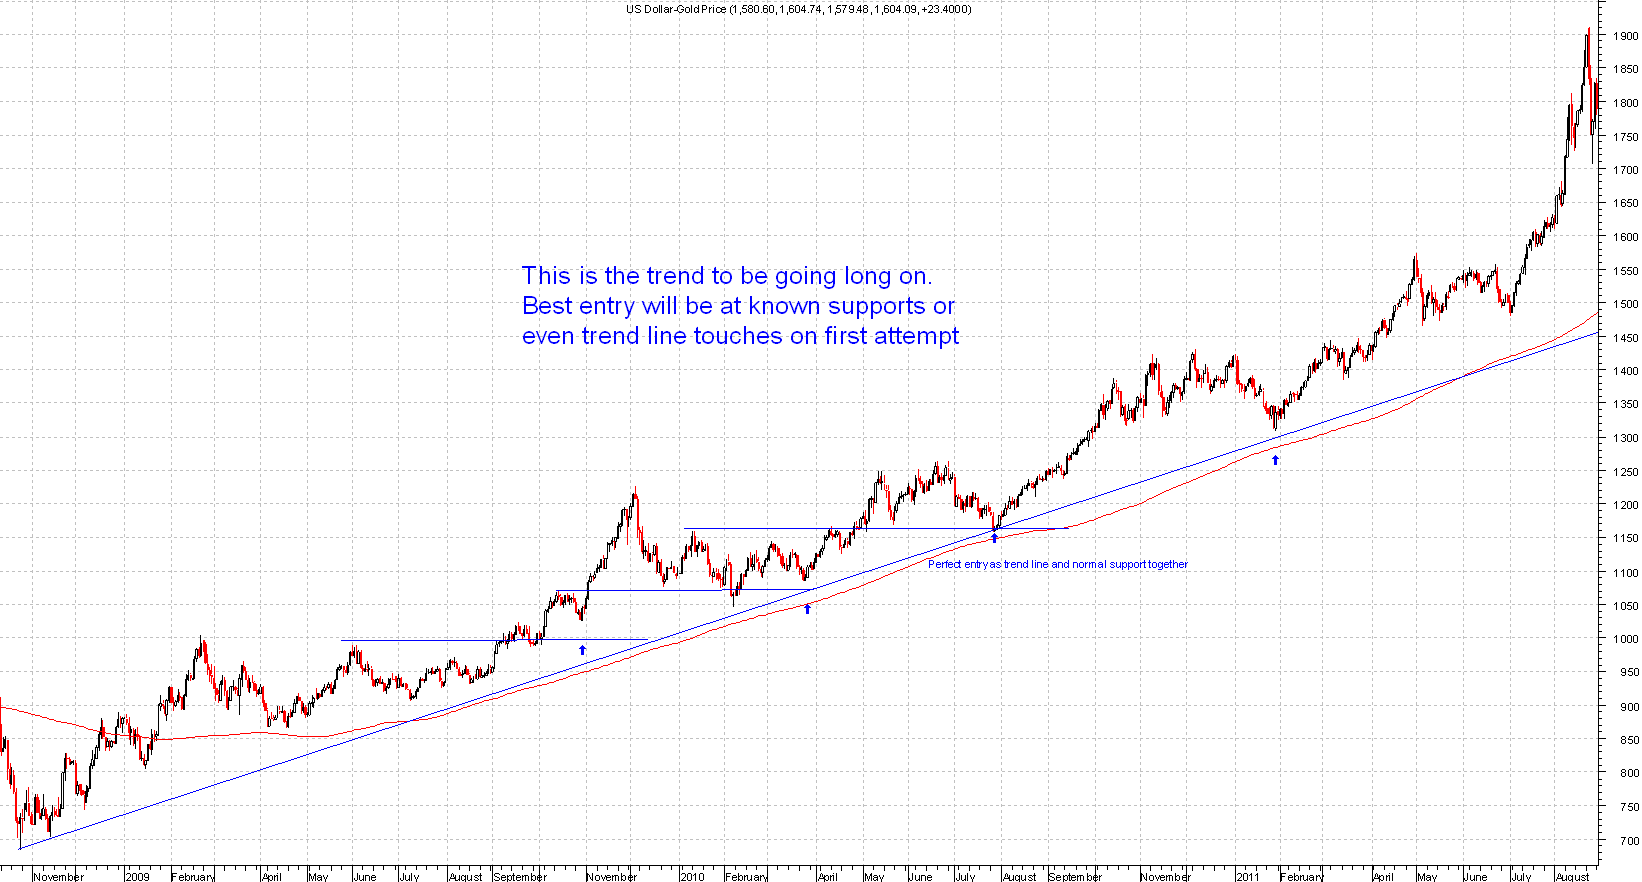
This is the trend to be going long on, this is drawn by joining the bottoms together.
Best entry will be known support or even at the trend line touches as long as you draw them correctly. When you draw uptrend lines you should join the extremes bottom together.
The more touches the better, two points of contact is needed to draw a trend line and a third to make it valid.
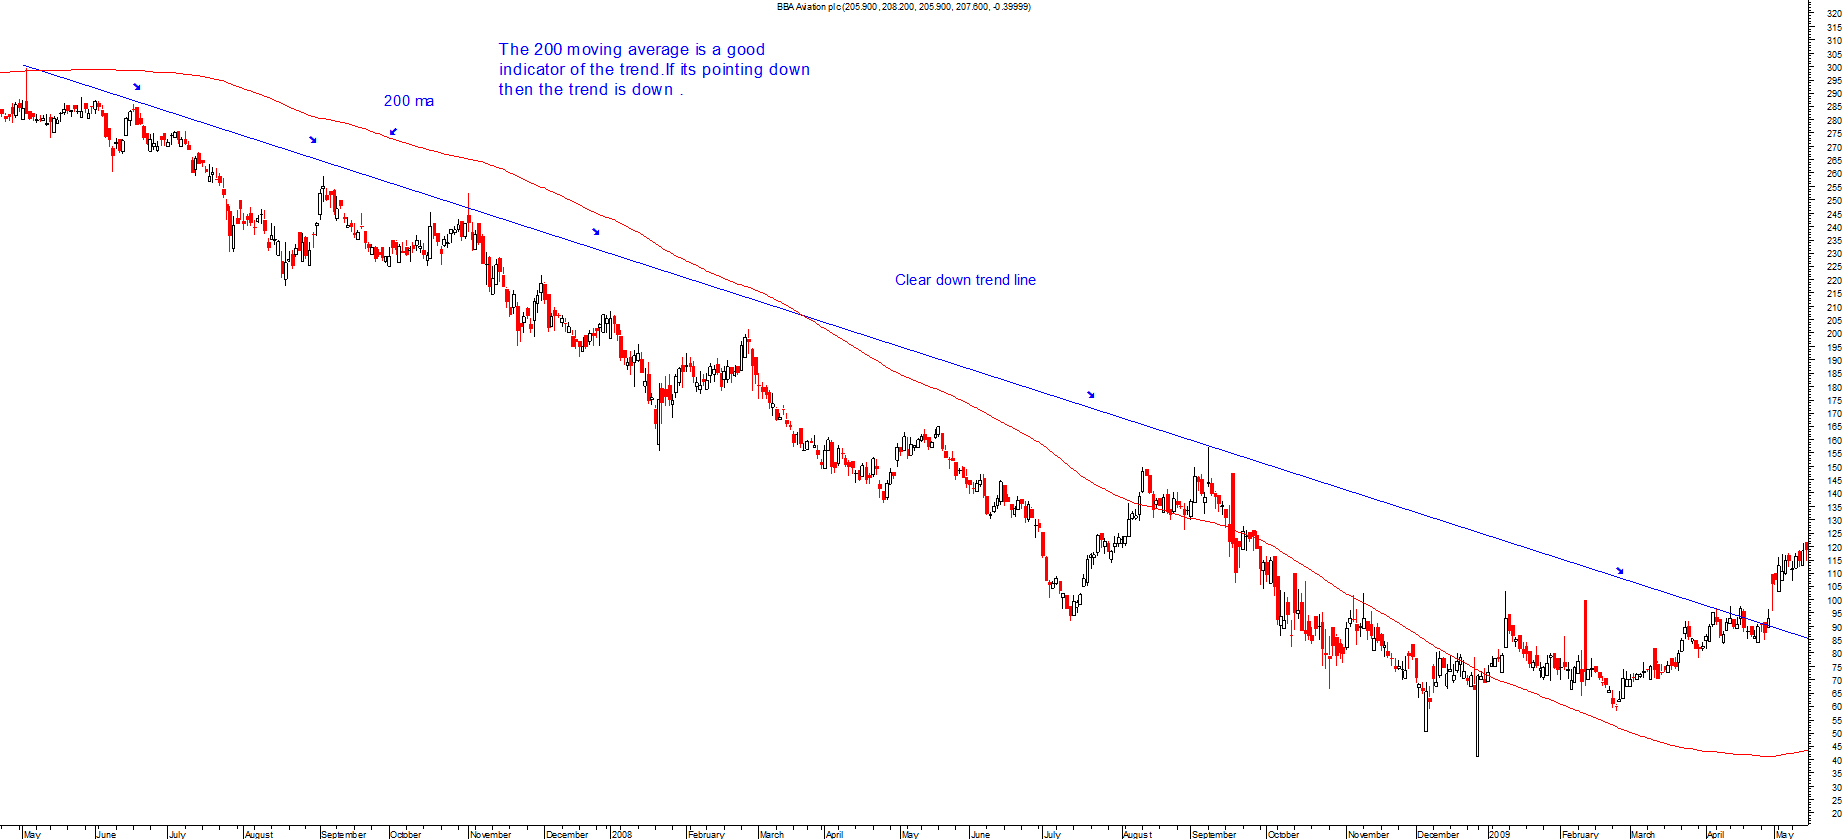
This is the opposite of the uptrend, this is drawn by joining the tops together. Always use the extremes to join the down trend lines as shown on the chart.
In the chart below, the trend line is drawn by taking into account the extremes. You can see the main down trend line, you could see a smaller trend within the main trend as well.
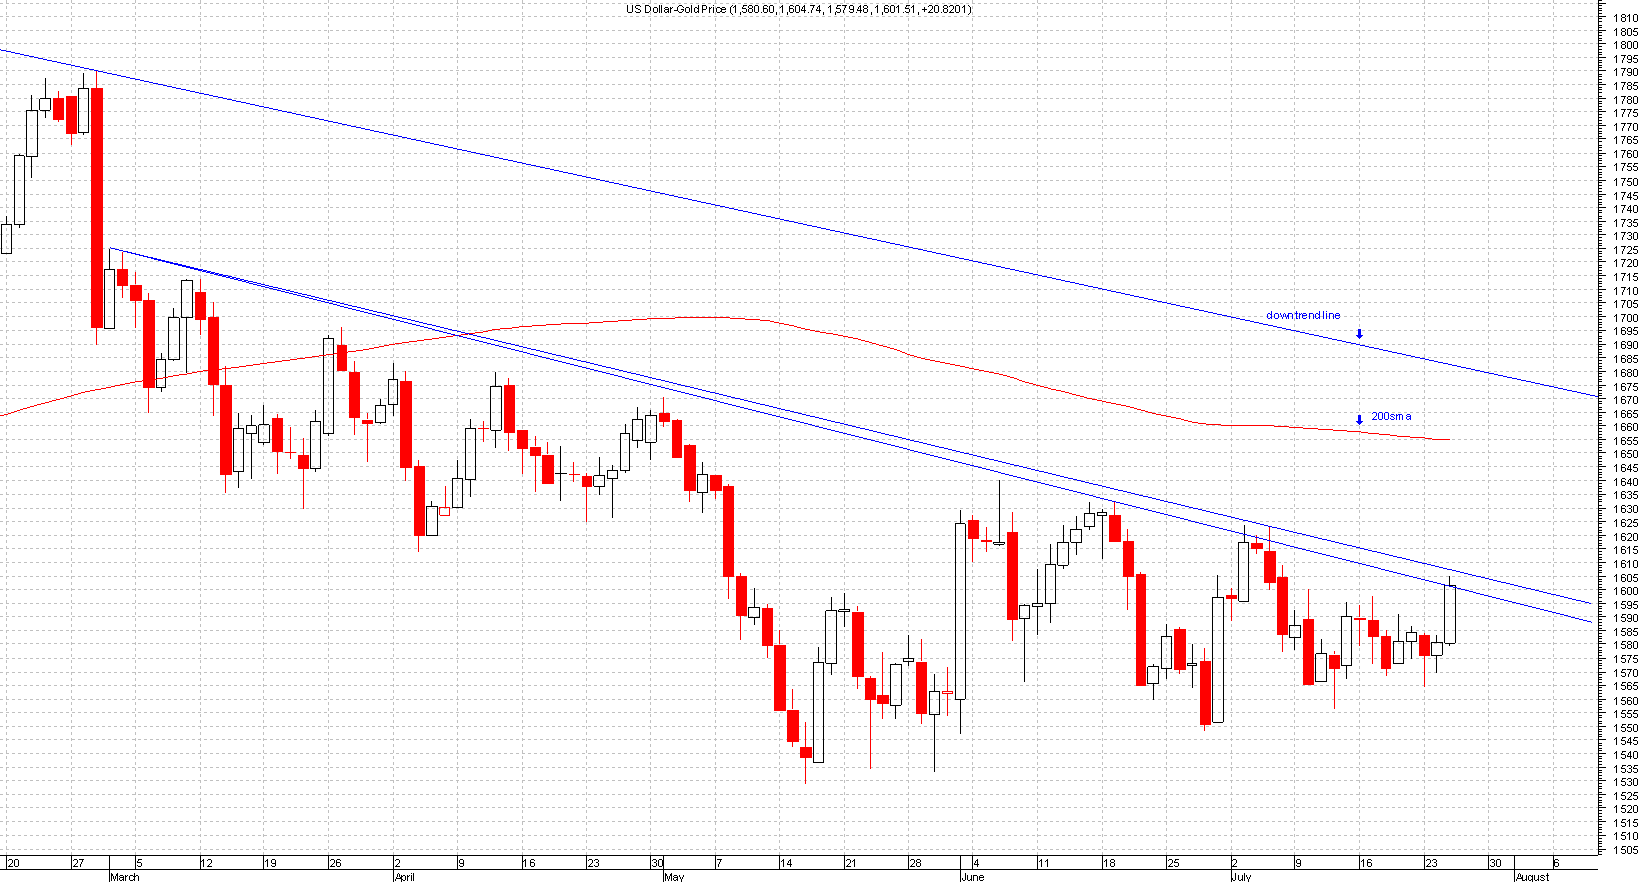
When in a clear downtrend then positions should only be taken by shorting, if unable to short then stay out of the market.
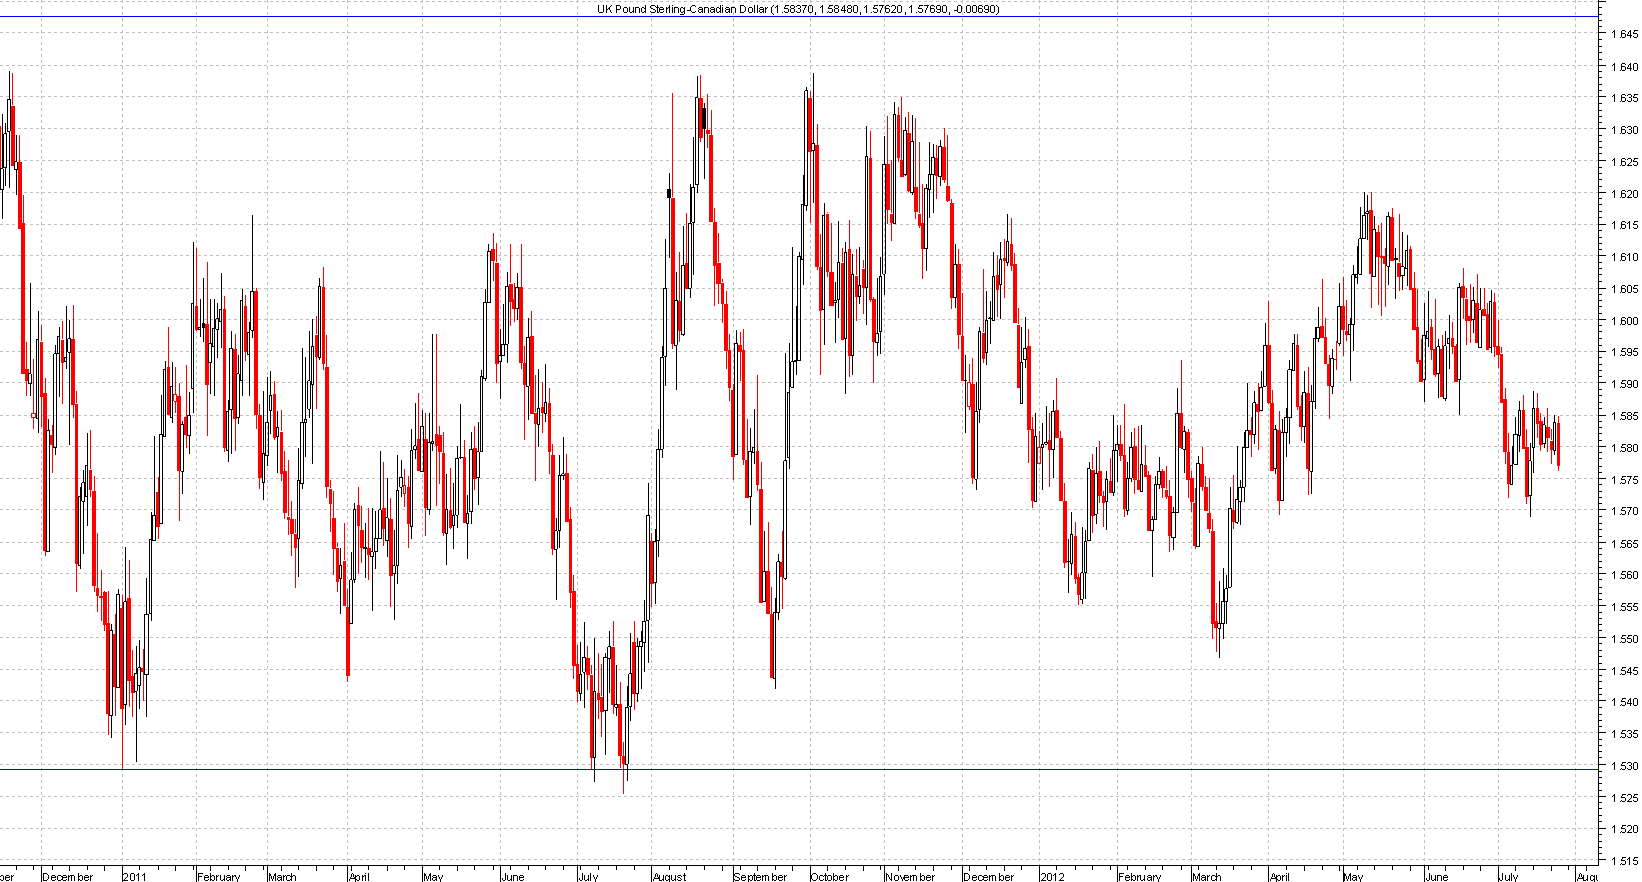
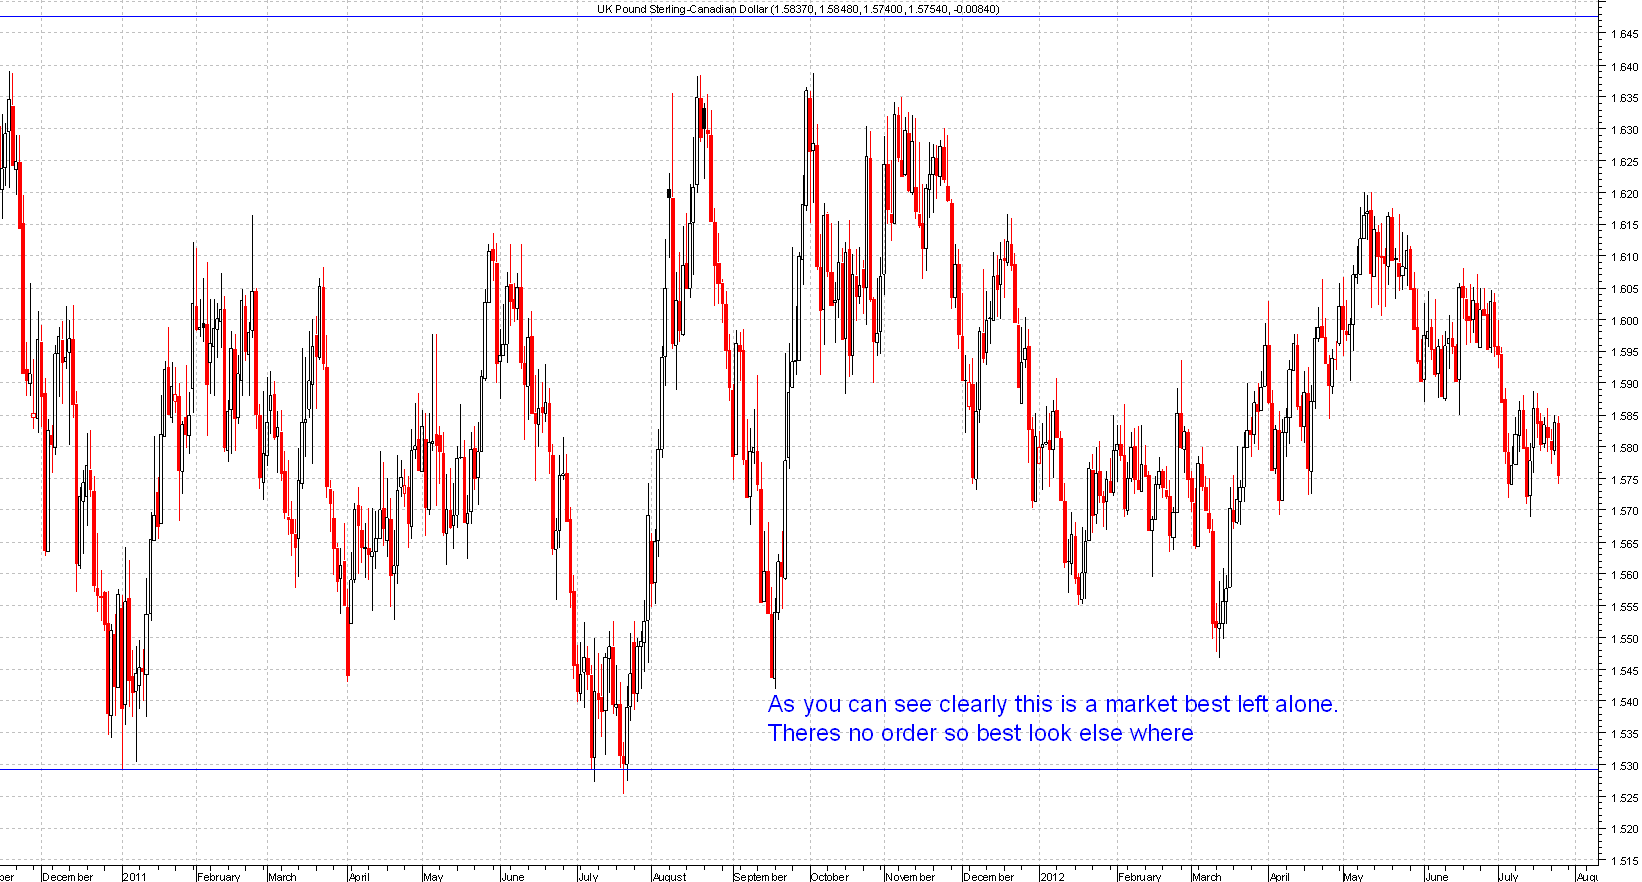
When you have a sideways move it represents a period of equilibrium in the price. This normally represents a trend less market.
When you have sideways market the best thing to do is stay out of the market. When using stop losses sideways move normally takes them out which makes it very hard to trade so best left alone unless you trade the ranges.
If you are have difficulty in identifying a trend then the best way to determine a trend is using a 200 day simple moving average.
All you have to do is look to see if it's pointing up or down or sideways. If it's pointing up then you know the trend is up, if its down the trend is down and finally if it's going sideways then the trend is sideways.
The moving average can be altered depending on your what type of trader you are. If you're a long term trader then 200sma(simple moving average) will be fine.
If you're a short term trader then you may look at 21 days sma or smaller time frames.

You can use this method on index trading and currency mainly but you can use this on any form of trading. If your betting on the index to go up or down then your betting on the points.
So if your betting on the index to move higher then you would place 3 contracts to go long, which would mean:
• £3 a point trade.
• £1 for one contract.
• 3 contracts.
So once in the trade you would close 1 contract down after 20 points in your favour(or near the first resistance level near by), which ever you are comfortable with.
You then bring your stop losses to break even on the remainder of the contracts so taking all the risk off and in doing so you have got yourself a free trade as such.

Now you can set your self a limit on 1 off the 2 contracts left to close out at 50 points from original entry(or the next level of resistance).
Once this is closed out you can then adjust your stop on the last contract and let this one be your greedy trade.
The idea behind the 3 contract rule is to pay yourself to trade, most people don’t do this so hence why most traders lose.
Its a very simple system for money management and it helps in creating discipline. This will also help you take away some of the emotions out of trading.
Emotions is some thing that every new trader will experience and can be a big hindrance whilst trading. A trader that leaves emotions out of trading will stand a better chance of beating the markets