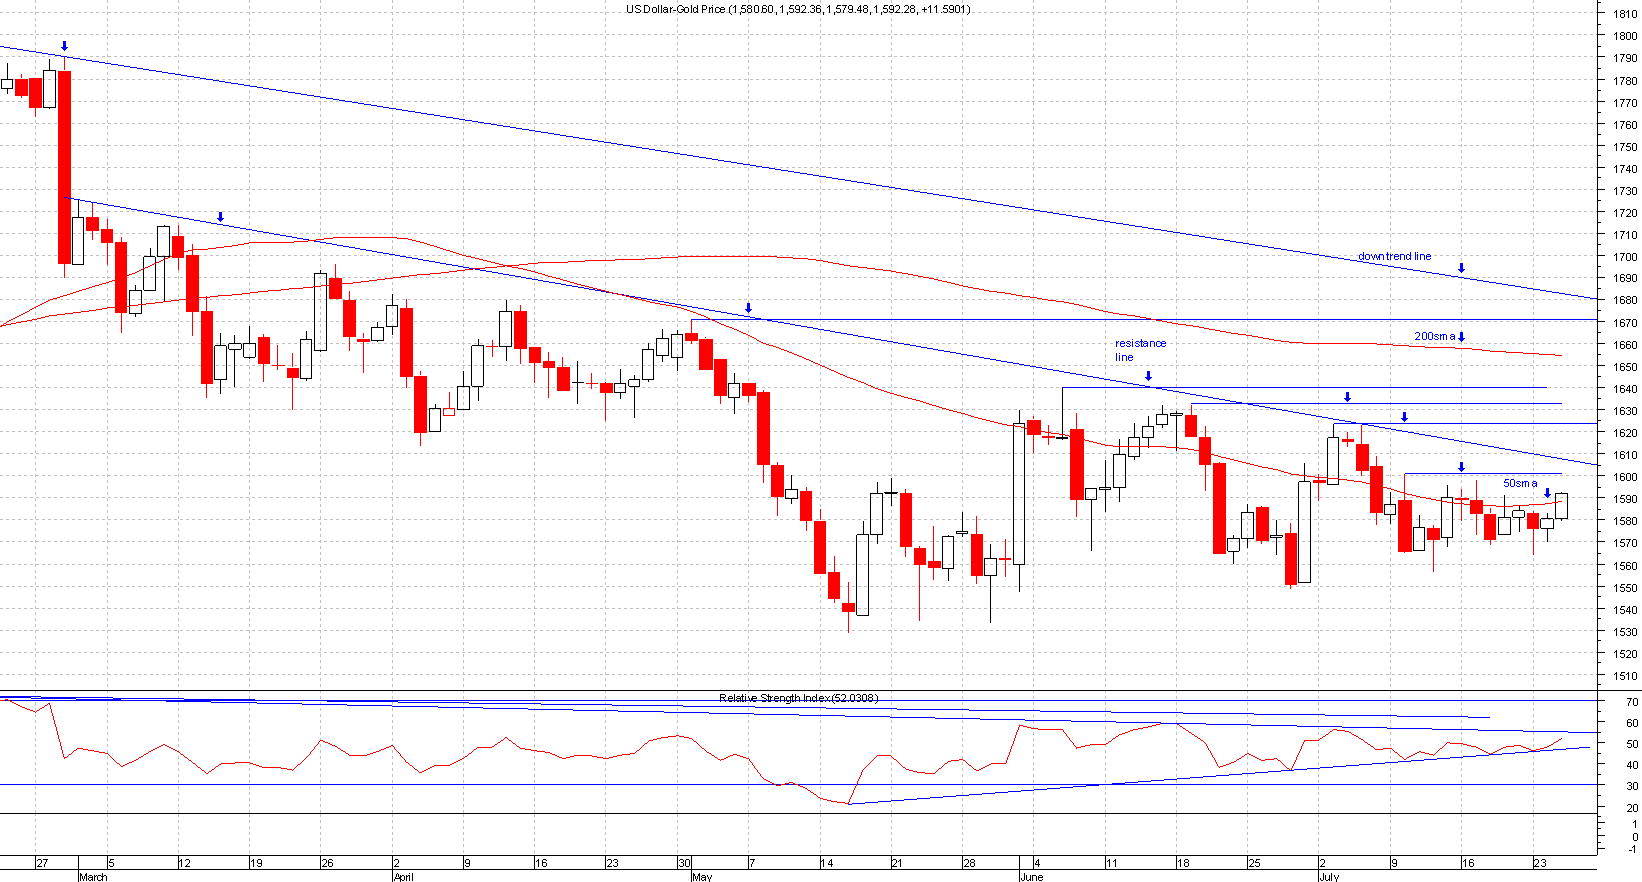
Resistances are the opposite of support levels. This is when buyers are out numbered by the sellers in the market.
This level is normally identified by a previous peak, this is the level that you should take profits.
Resistance comes in many forms:
• Previous reaction high
• Downtrend lines
• Gaps
• Fibs
• Moving averages
• Ichimuku cloud tops
Once a resistance is penetrated it normally becomes support, never buy at resistance.
If you study the chart below you should be able to tell how to draw resistance, the chart below shows examples of resistances on gold.
Please click on chart below for larger image
These are basically symmetrical triangles and the difference being the time frame.
The Pennants only take 1-2 weeks to build where as a symmetrical triangle could take from 1 month to 3 months to build.
Volume is normally low during the formation but high once it breakout, please bear in mind that this is dependant on time frame e.g. Hourly to intraday will form a lot quicker.
Please click on the chart below for larger image
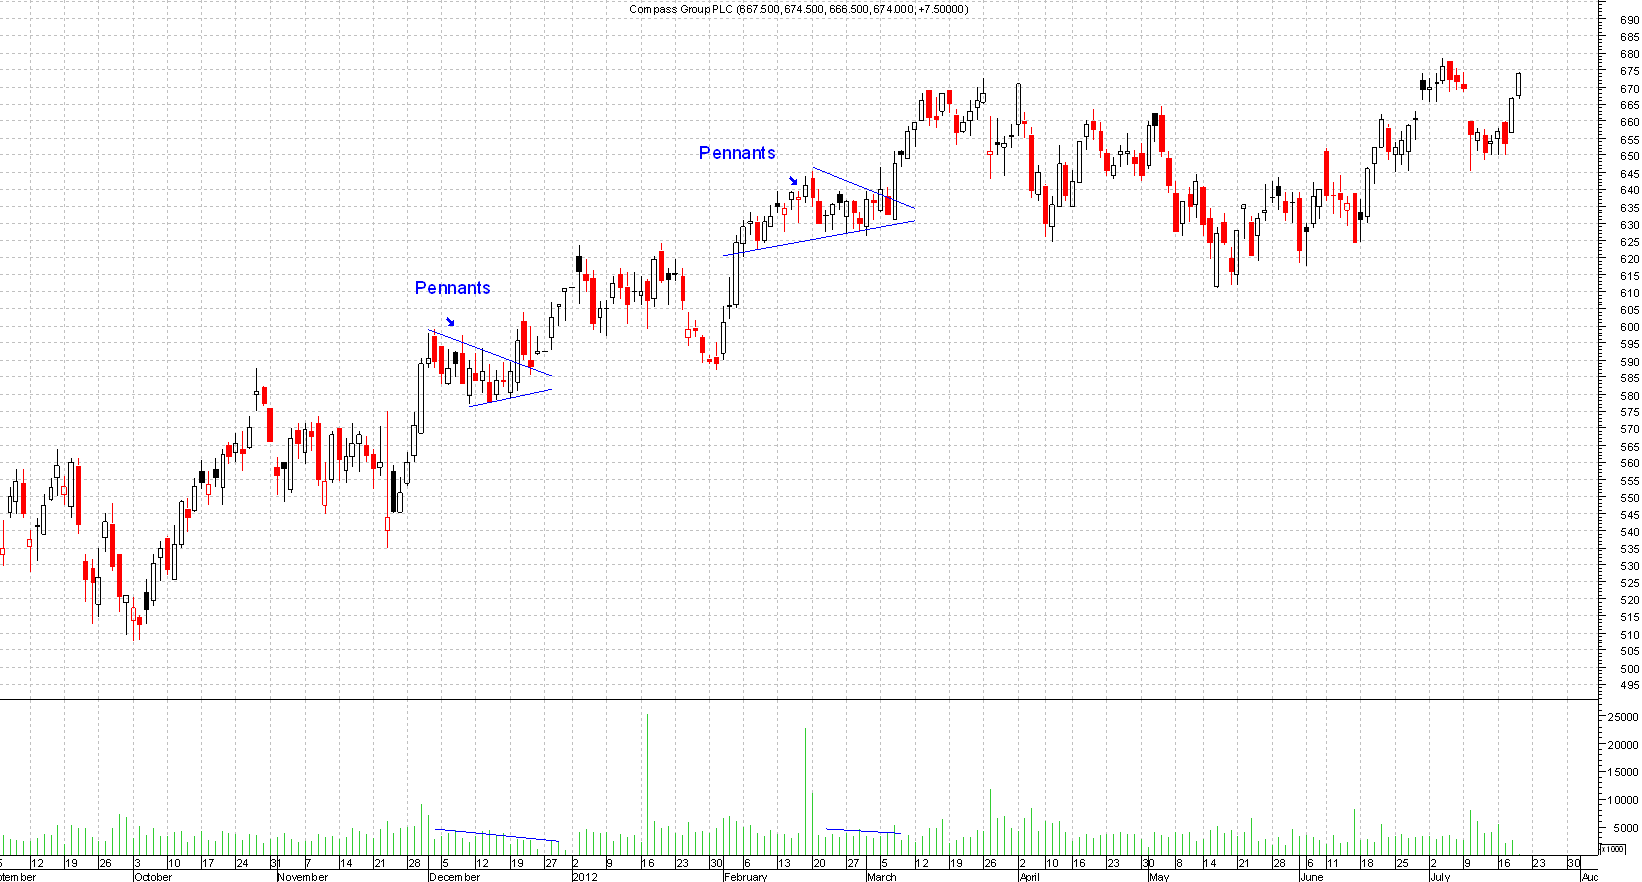
These pennants formations usually form and appear at the mid-way point of a trend.
This is the opposite of a head and shoulders pattern. (See the article on head and shoulder pattern).
The only true difference is the volume, bottoming patterns tends to have higher volume associated with them. This forms at the bottom of a trend.
You have to have keen eyes to spot this developing as first signs are the higher highs, which will be forming the right shoulders which is right near the signal line(neck line).
Please click on the chart below for larger image

This is by far the most famous and popular charting pattern. This pattern consists of a left shoulder, head and a right shoulder.
The head and shoulders appears at the top of a trend and nowhere else.
Please click on the chart below for larger image
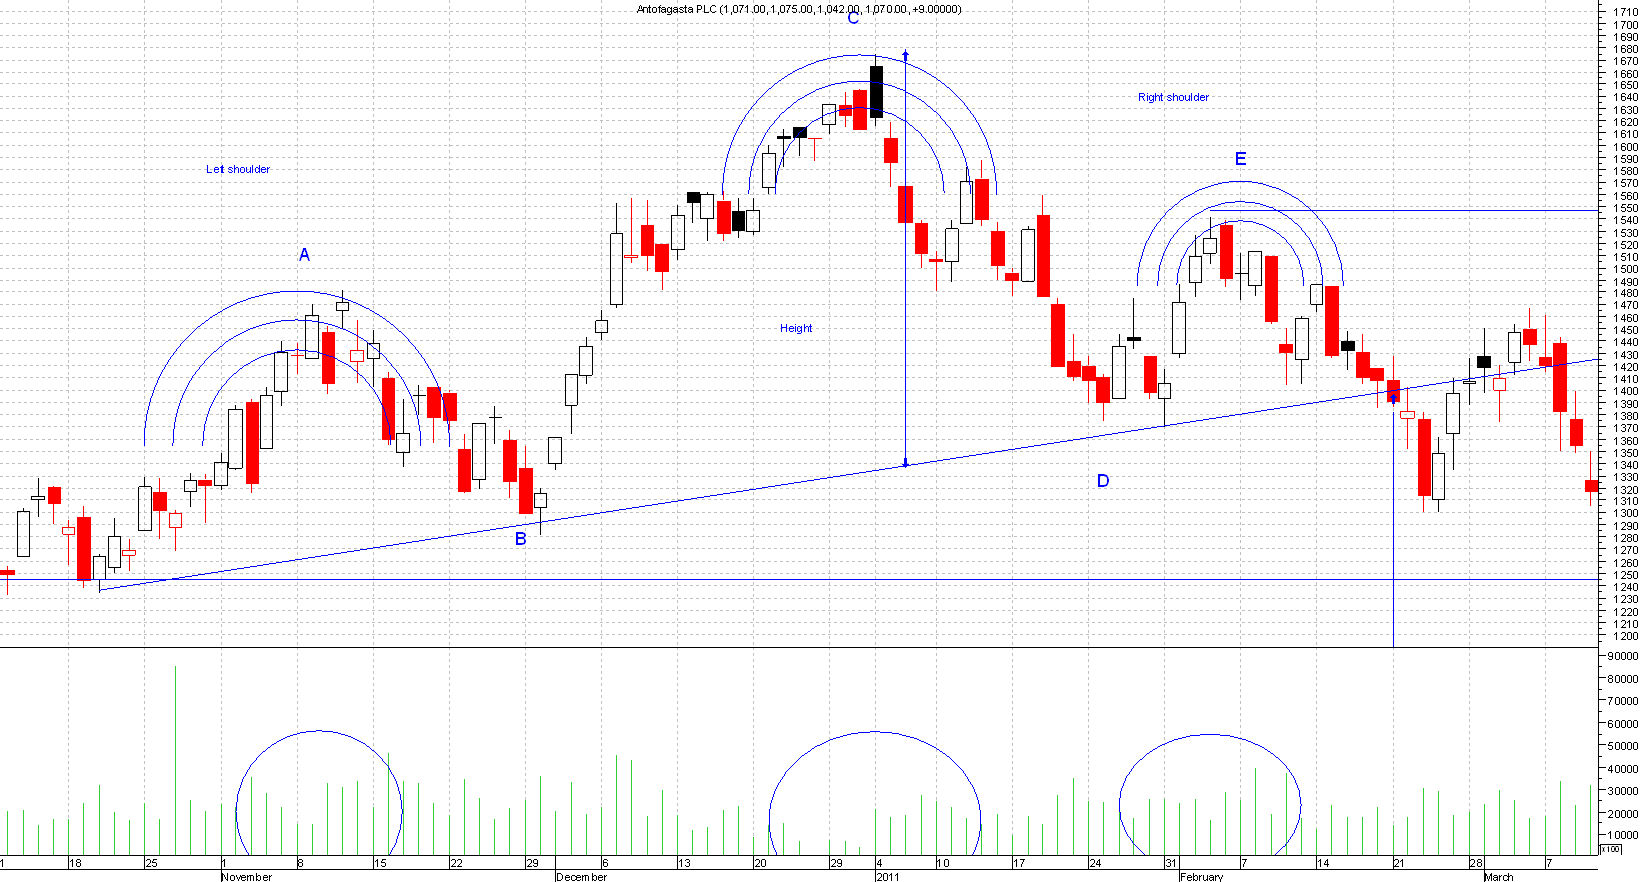
The build up of the left shoulder maybe accompanied by higher than normal volume, point A, then a retrace point B, this will normally be of low volume.
Then you have a rally to point C, this is the head forming. This could be light volume, this passes point A (left shoulder) and then a retrace to point D.
This decline goes lower than point A(left shoulder), at this stage you could get an idea of what's forming. The peak of point A should have held as support so alarms bells may start ringing at this point.
Then you have a rally to point E(right shoulder), this should be light volume. This fails to go higher than point C(head) which is a big no, as each rally should go higher than the previous peak in an uptrend.
So at this point you can draw a neckline from point B through to point D and extend to the right. The sell signal comes once the neckline is breached and higher volume is possible.
If you missed the sell at the neckline break out you can, if lucky, start shorting on the retest of that neckline from below. This doesn't always happen but is most likely. It is also a good idea to get a confirmation of resistance as that adds to the signal.
Please click on the chart below for larger image
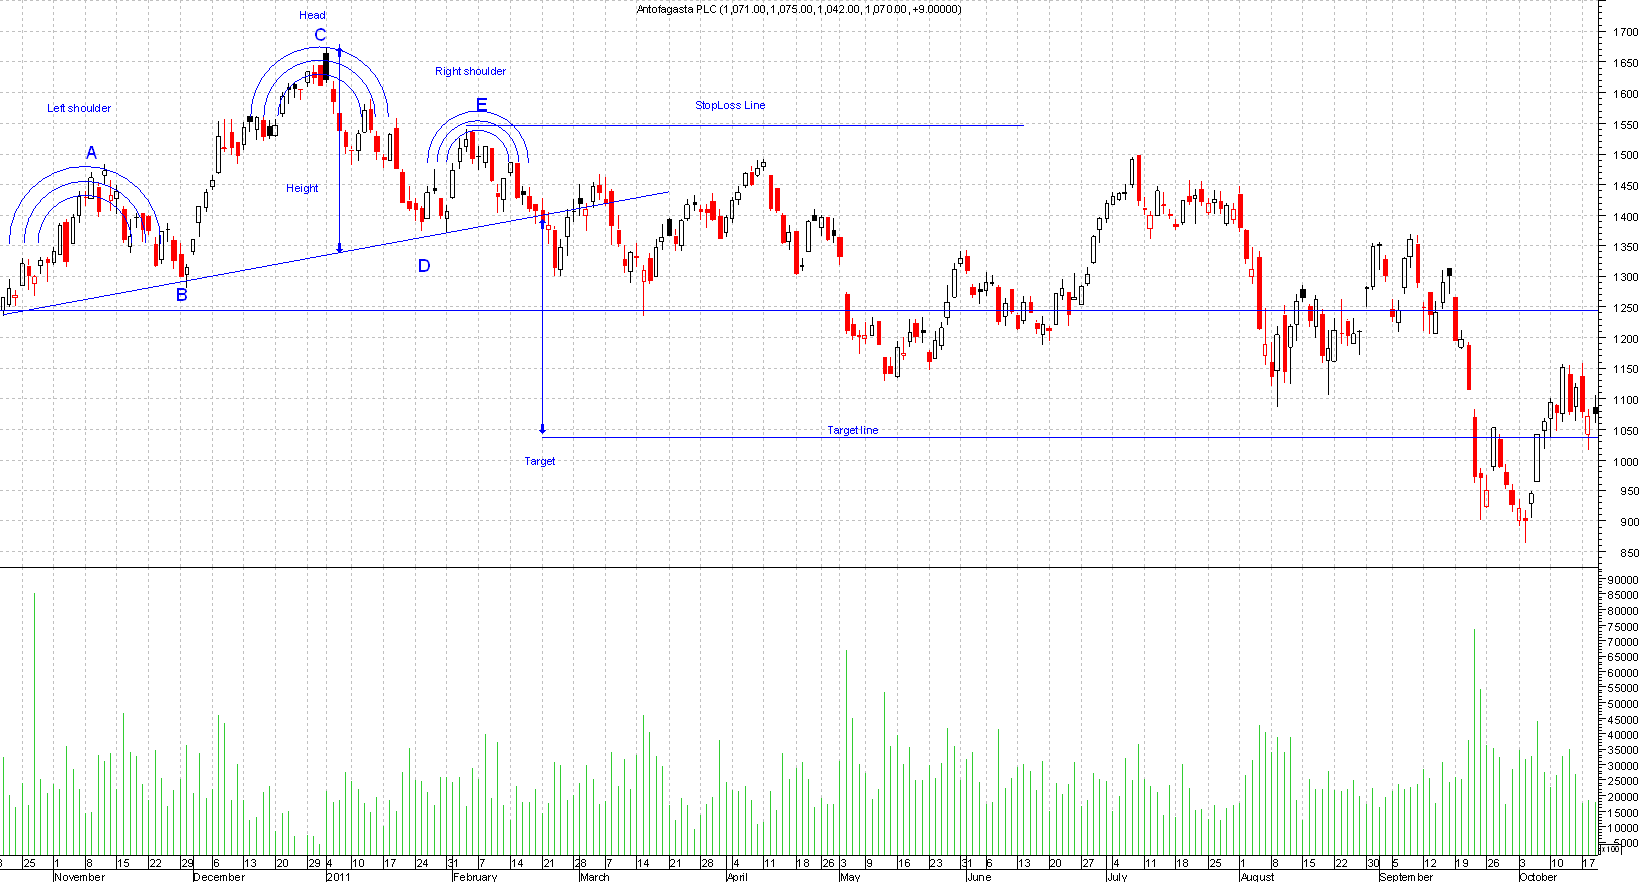
Once you know you have a head and shoulders break then you take the height (head) to the neckline and that distance should be projected from the break out point and you have your target.
From the chart you can see the target got hit a few months later.
Stops should be placed above the right shoulder. Some risky traders like to put the stops above the head but that is taking on way to much risk and the risk reward ratio is too low.
Once the neckline is breached and finished below it, prices should not go above this. If prices did go above this then chances of a failed head and shoulders are high and the previous trend may resume hence why the stops are above the right shoulder.
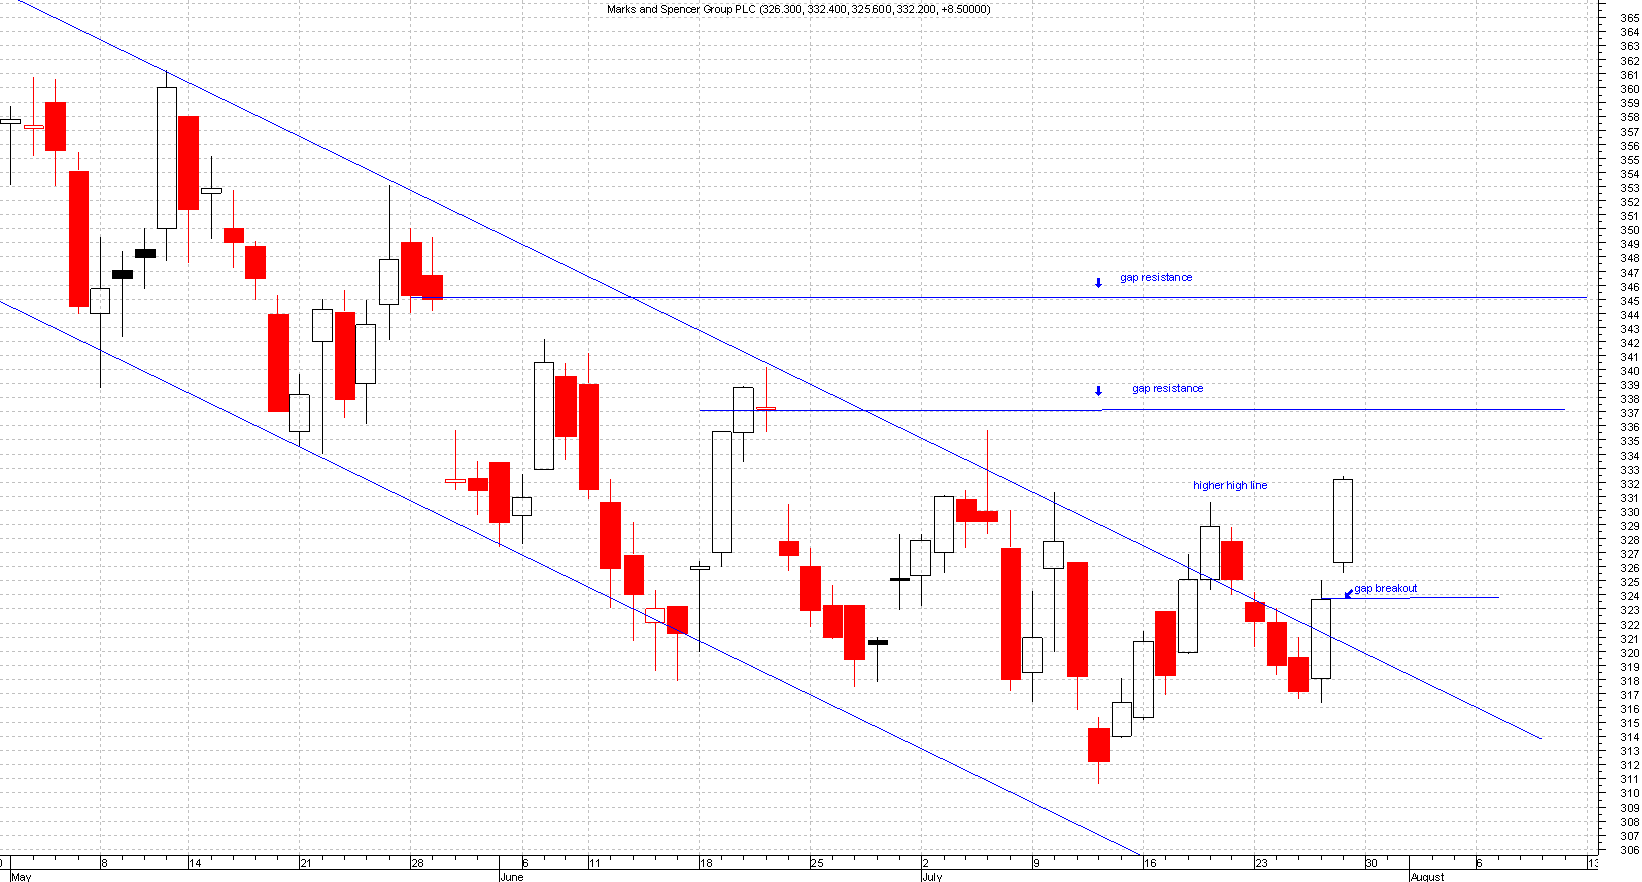
Gaps occur when a price chart opens higher (or vice versa) than the previous days close. Where no trading has taken place is usually a good time for gap trading to be profitable.
The way to use them is if the trend is up and the price approaches a previous gap then you should go long at the bottom of the gap.
Obviously the opposite is true for a downtrend, gaps are also good for future supports and resistances.
There are 3 types of gaps:
This forms at the beginning of a major move, like after a range bound breakout. It should also have high volume attached to this.
Please click on the chart below for larger image
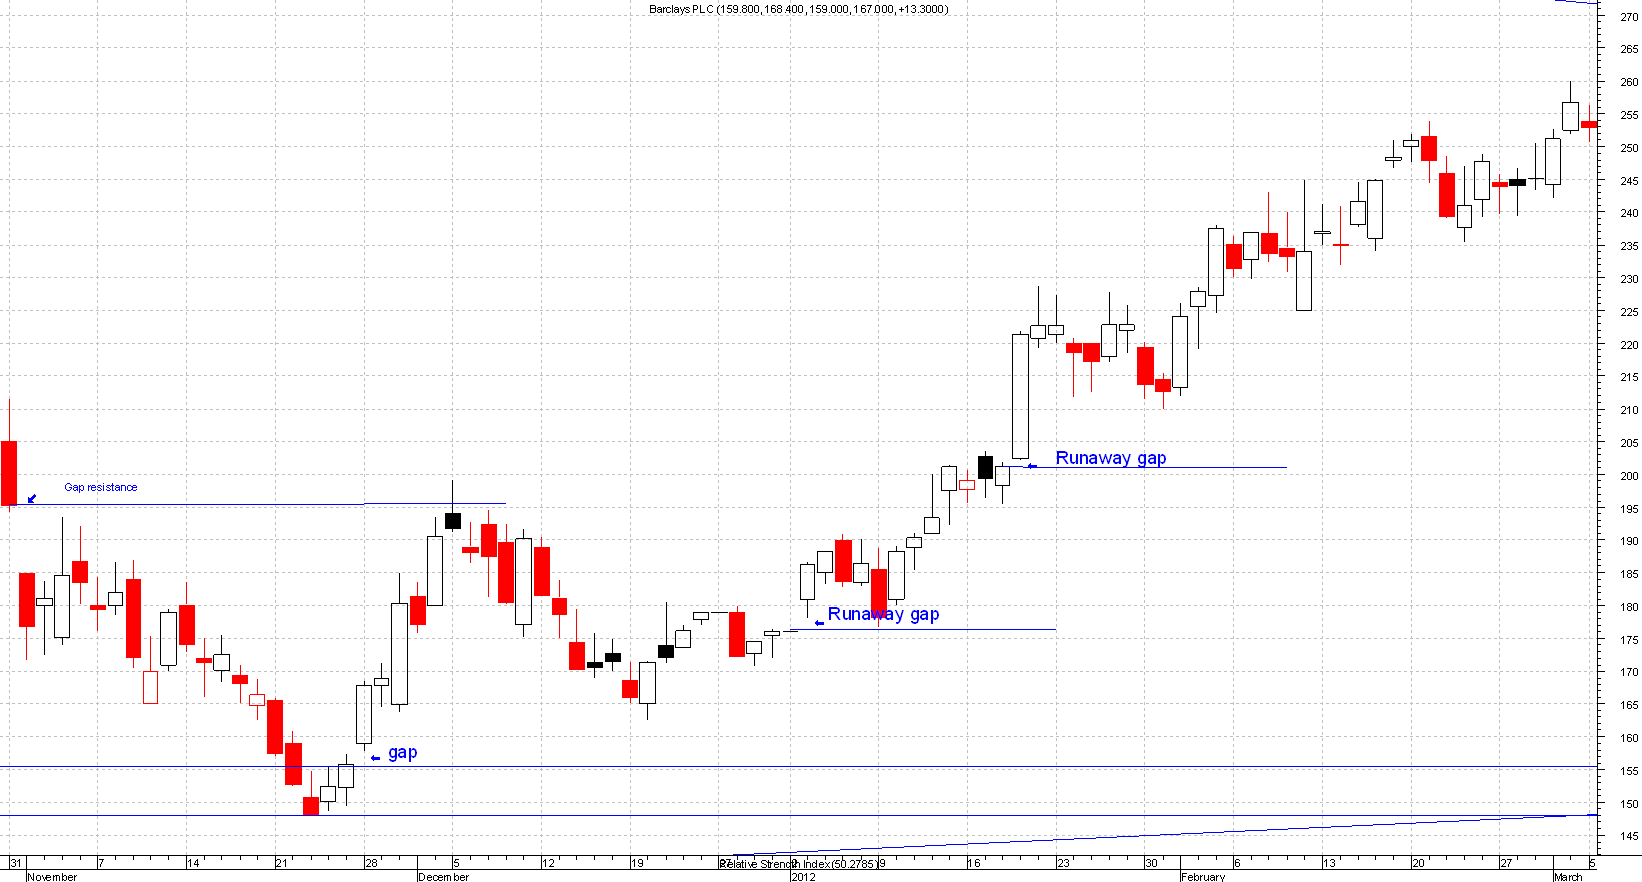
This happens during a rally or after a few days of sustained up or down moves. Prices will gap forward to form a runaway gap.
This is a sign of market strength, or weakness depending on direction. Also worth noted is that when a correction happens and we are in an uptrend, the gap becomes a good level to top up on.
The bottom of the gap acts as support and the reverse is true of a downtrend.
Please click on the chart below for larger image
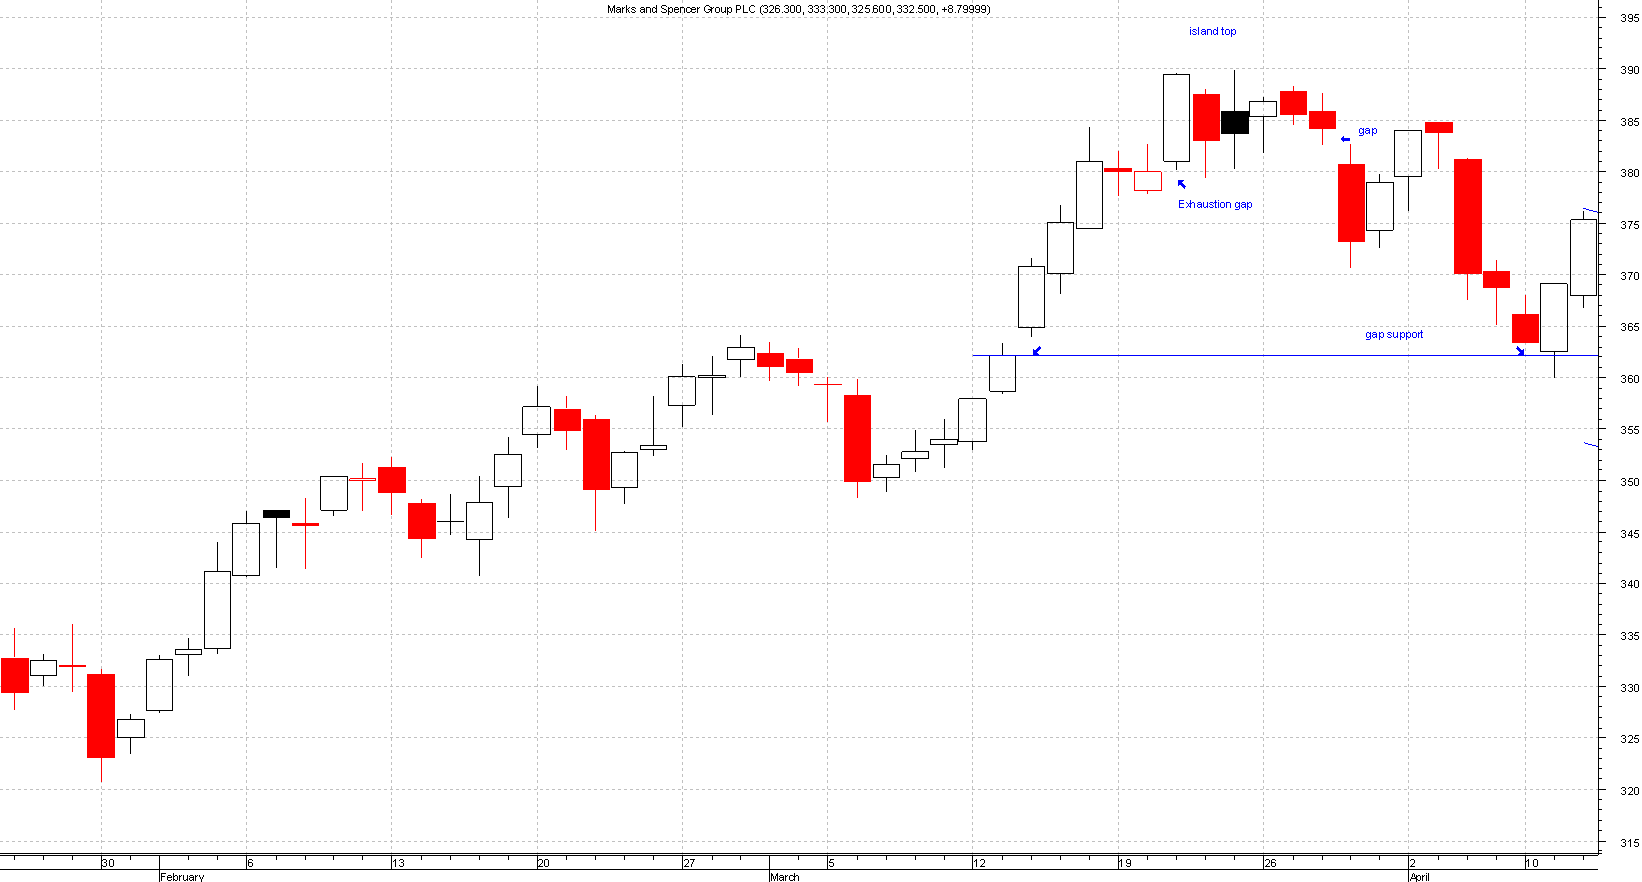
This comes at the end of a rally and signals a change. This can be identified by a close of the gap within a few days of the gap forming. This can be an early indication of possible tops or trend change.
Please click on the chart below for larger image
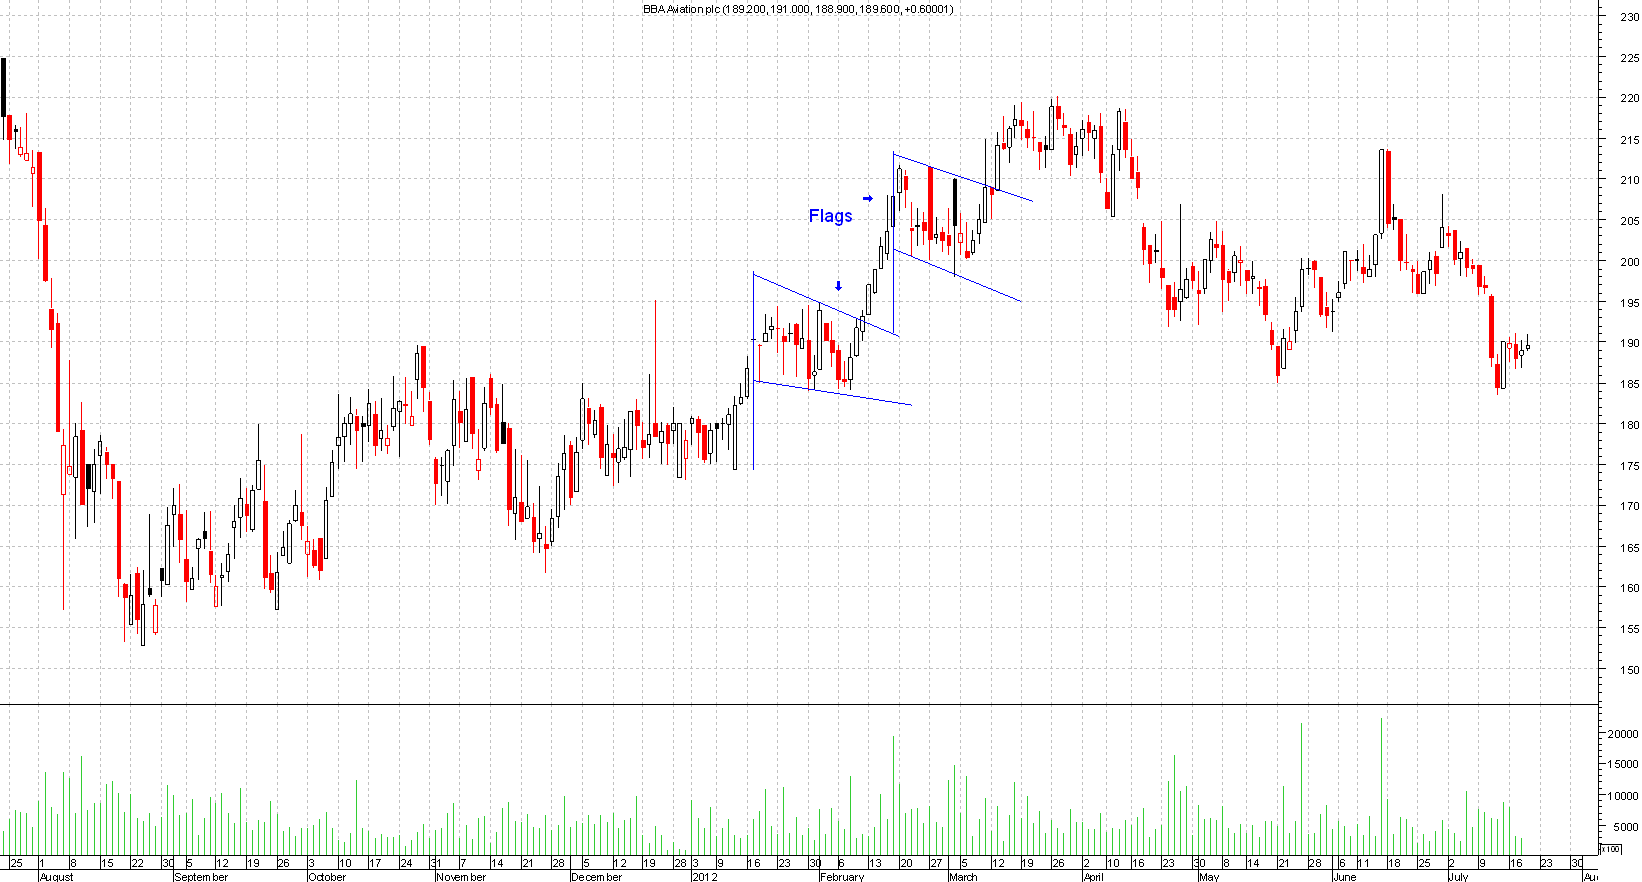
The flag pattern is a continuation pattern and as suggested by the name these pattern form to look like a flag.
They have 2 parallel lines that are slightly on the slope. This slopes up in a downtrend and slopes down in an uptrend.
Flags generally appear in the midpoint of a trend, volume is normally low during the formation but high once it breaks out.
Please click on the chart below for larger image
If it's in an uptrend then it should breakout above the top parallel line and the opposite for a downtrend.
These patterns only last a very short term say 1-2 weeks long. This is the time the shares build its strength.
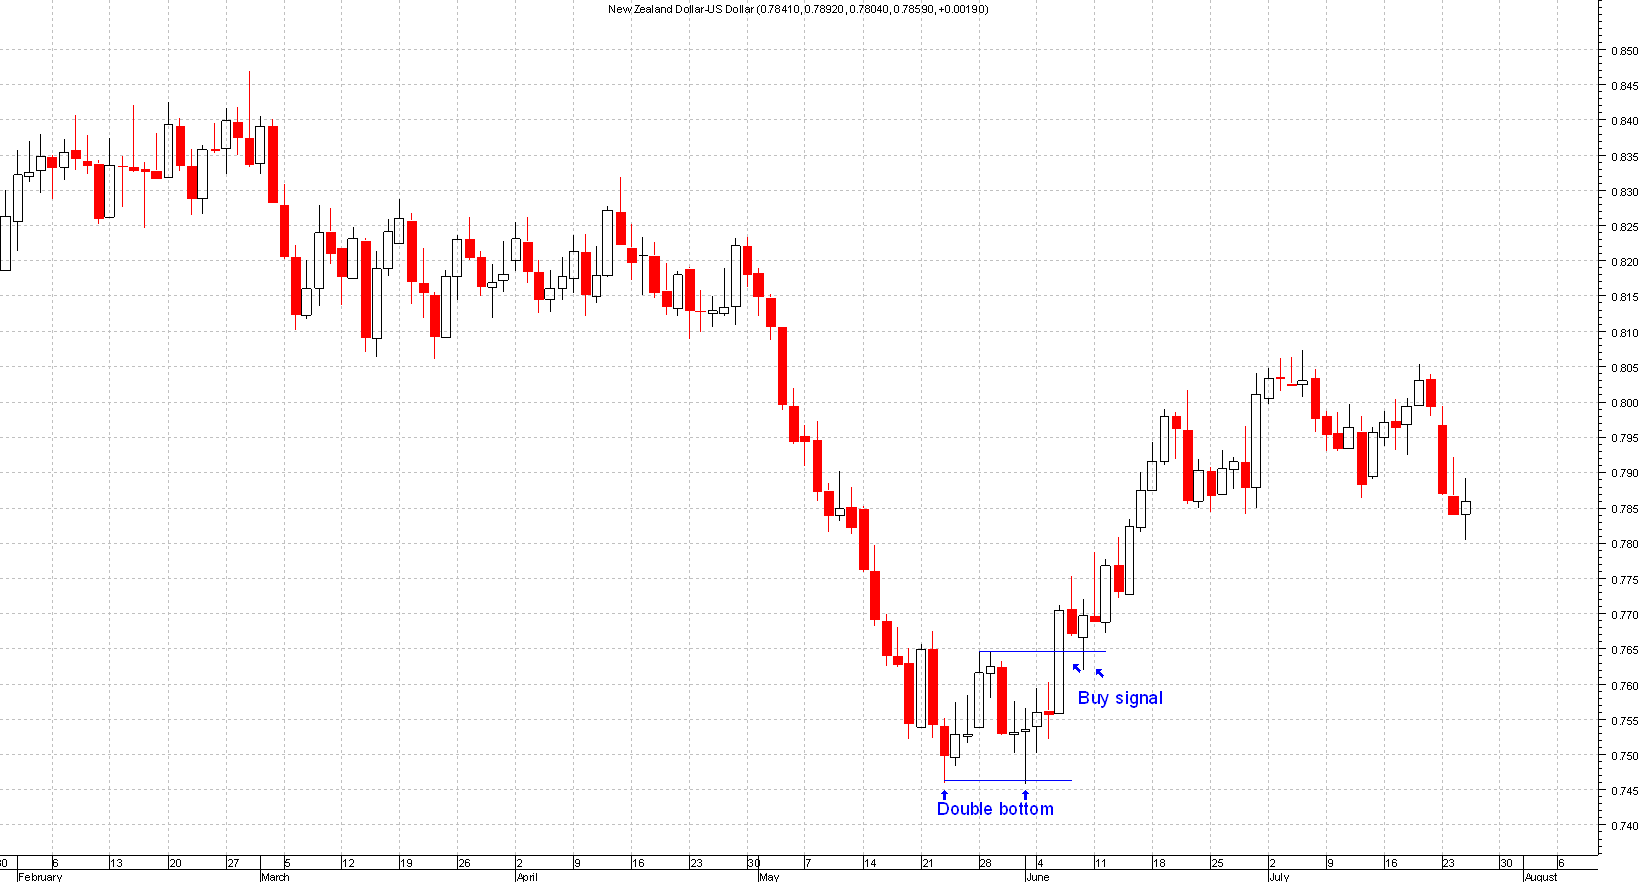
This is the opposite of the double top (see double top article), like most technical patterns the 2 peaks don't have to be spot on but close enough by a few points.
This pattern has 2 similar lows then followed by a rally, the break of the middle peak should have higher volume associated with this to generate the buy signal.
Stops should be below the double bottom but the problem with this is that it could be a big risk if it's a few hundred pips away, so risk management should be incorporated with all stops.
Please click on the chart below for larger image
When trading double tops or bottoms be very careful as these patterns are really common.
You do get a lot of false signals with these trades due to the fact that in an downtrend prices always reverse after a peak and then breaks lower, that attempt at the break lower is what causes the problems.
People second guess this, which is the same for an Uptrend.