Candlestick patterns are among the most practical tools you can learn as a trader. They tell you the story of what's happening between buyers and sellers within a single bar or across several bars. Once you understand what these patterns mean, you'll start seeing trading opportunities that others miss. In this guide, we'll cover the essential patterns every trader should recognise, from simple reversals to complex multi-candle formations.
The doji is one of the most widely recognised candlestick patterns, and for good reason. It appears in virtually every market—stocks, forex, commodities, cryptocurrencies—and it tells a clear story about what's happening between buyers and sellers. In this guide, you'll learn not just what a doji is, but how to use different doji variations to identify potential turning points in the market.
Engulfing patterns are among the most powerful candlestick reversal signals you'll encounter. They're straightforward to identify, appear across all markets, and when they form at key levels, they can mark the beginning of significant moves. In this guide, you'll learn exactly what makes an engulfing pattern, how to trade them with proper confirmation, and how to avoid the common mistakes traders make.
The hammer is one of the simplest yet most powerful candlestick patterns you'll learn. Its distinctive shape—a small body with a long lower shadow—tells a clear story about rejection of lower prices. When you understand how to trade hammers correctly, you'll start seeing profitable setups that other traders miss. This guide takes you through everything you need to know about hammers, hanging men, and related patterns.
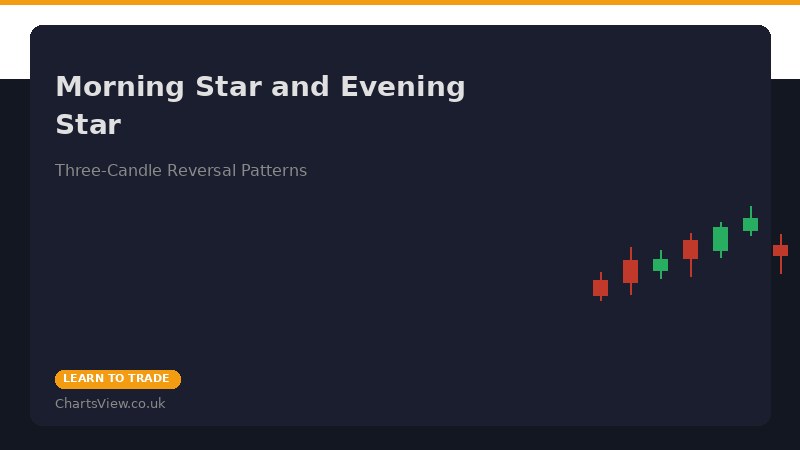
The morning star and evening star patterns are among the most reliable multi-candle reversal signals in technical analysis. They're more complex than single-candle patterns, but that complexity is exactly what makes them so powerful. A three-candle reversal pattern gives you more evidence of a genuine trend change than a single candle ever can. In this guide, you'll learn how to identify these patterns, trade them effectively, and avoid the common mistakes traders make.
A double top pattern is one of the most reliable bearish reversal signals you'll encounter in technical analysis. If you've been trading for a while, you've probably seen price reach an all-time high, pull back, rally again to around the same level, and then collapse. That's the double top in action. Understanding how to spot and trade this pattern can save you from being caught holding the wrong side of a reversal.
Wedge patterns are among the most underrated trading opportunities in technical analysis. While many traders chase breakouts from support and resistance levels, they often miss the wedge patterns forming right under their noses. These converging trendline patterns set up predictable breakouts with excellent risk-reward ratios. Once you understand how wedges work and how to distinguish them from similar patterns, you'll see trading opportunities you previously overlooked.