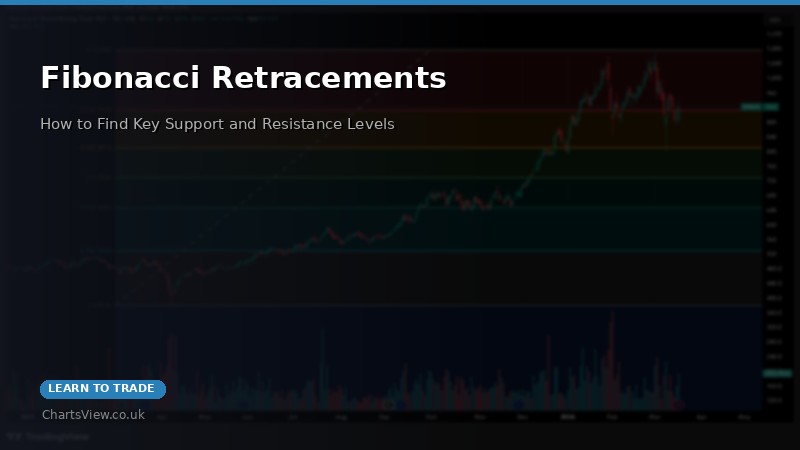
Fibonacci retracements are among the most widely used tools in technical analysis, yet many traders apply them incorrectly or dismiss them entirely. If you've ever noticed that price tends to find support or resistance at seemingly specific percentage levels during a pullback, you've witnessed the Fibonacci retracement at work. In this guide, you'll learn exactly how to use these levels to identify high-probability trading opportunities and combine them with other technical tools for maximum effectiveness.
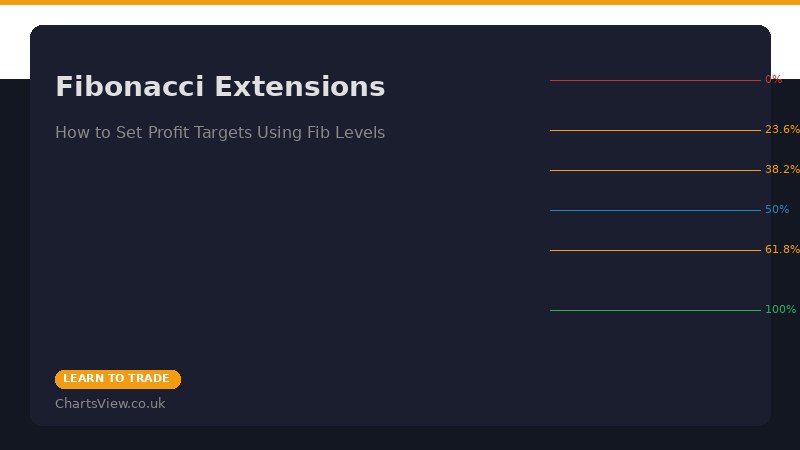
Fibonacci extensions are one of the most underused but powerful tools in technical analysis. While many traders know about Fibonacci retracements (the pullback levels), extensions are what separate the profitable traders from the struggling ones. Extensions let you project your profit targets before you even enter the trade. Instead of guessing where to take profits, you use mathematical precision based on the market's natural geometry. If you trade UK stocks like Rolls-Royce, Sage, or Ocado, understanding extensions will transform your risk-reward profiles and help you exit winners at exactly the right moment.
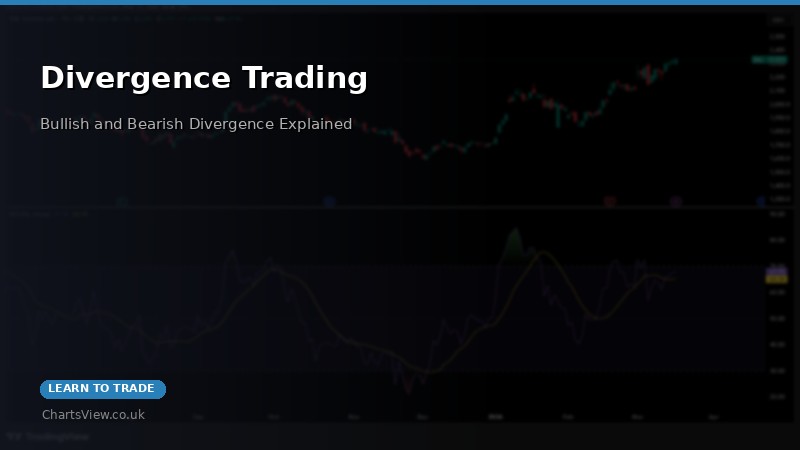
Divergence is one of the most reliable early warning systems in technical analysis, yet it's often overlooked by newer traders. When price makes a new high but your indicator fails to confirm it with a new high of its own, something is wrong. That mismatch—that divergence—is telling you the trend is weakening. In this guide, you'll learn to spot divergences before they happen, understand what they signal, and use them to enter trades at major turning points.
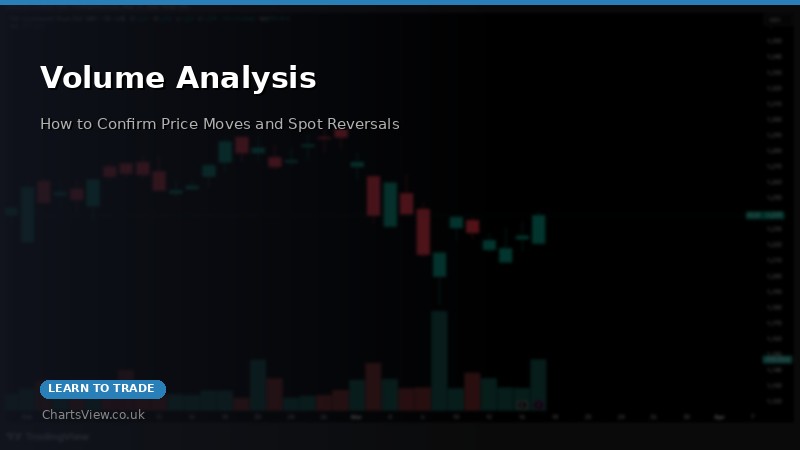
Most traders stare at price and ignore the volume beneath their charts. That's a critical mistake. Volume is the heartbeat of every move—it tells you whether a price movement is backed by conviction or is just a false bounce. A rally on high volume means professionals are buying aggressively. A rally on low volume means nobody cares. In this guide, you'll learn to read volume as confidently as you read price, identify real breakouts from failed ones, and use volume to predict reversals before they happen.
Professional traders around the world have converged on a simple truth: price is the ultimate indicator. Everything you need to know about where the market is headed is written in the candlesticks themselves. The support and resistance levels, the rejection candles, the gaps, the volume climaxes—these price action signals are far more reliable than lagging indicators on a crowded chart. In this guide, you'll learn to read price like a professional, identify high-probability setups using only price and structure, and build a trading approach that works in any market condition.
When you first learn about support and resistance, you're taught to draw horizontal lines at price levels where the market has reversed. It's straightforward, it's intuitive, and it's incomplete. The real power of support and resistance lies not in exact lines but in zones—areas where price typically reacts. In this article, you'll learn why zones matter, how to identify them, and how to use them practically on your UK stock charts.
Price doesn't move randomly. It moves in patterns. The most fundamental pattern is market structure—the sequence of highs and lows that tells you whether the market is trending up, trending down, or going sideways. Understanding market structure is the foundation of determining direction, spotting reversals, and trading with the trend instead of against it. This article teaches you to read market structure like a professional trader.