Japanese Candlestick Charting
Technical Analysis has been used for centuries in Japan; it all originated from trading of rice and this is where the Japanese candlesticks method was born.
Japanese candlesticks came to the western world much later and were introduced by Steven Nixon in his book "Japanese's Candlesticks Charting Techniques". Japanese candlesticks are a very popular charting method used in trading all over the world.
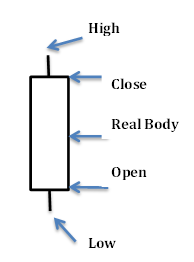
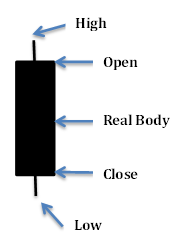
A Japanese candlestick depicts the price movement of a share including the opening and closing prices as well as the high and low price of a share on any given day.
The reason they are so popular is because they illustrate a great deal of information, it is clear to see patterns emerging and therefore they are fairly easy to use and interpret.
A great advantage they possess is they also provide visual signals and cues to the market sentiment and what investors are thinking, which is priceless information to have in trading.
Based on this information investors can decide what actions they must take to make the most out of the situation and ultimately be successful in their trade.
A basic candlestick
The filled part of the candlestick is called the body, the line above the candlestick is the high and the line below the body is the low. These lines are known as shadows, tails or wicks.
When the close of the day is higher than the open then the candlestick is white, which signals that it has been a bullish day.

When the close of the day is lower than the open then the candlestick is black, which signals that it has been a bearish day.

