Articles
This pattern is the opposite of the hammer pattern, as the name suggests it looks like a upside down hammer consisting of a small body with a long tail or shadow above the body but no or little shadow below the body.
If this pattern comes at the end of a down trend it could signify reversal in the trend. This is because the bulls have pushed the price higher but although the bears have pushed the price to close lower they could not push the price to a further low than the opening price.
This means the bulls have more control of the market. However, to confirm this bullish pattern further you would need the next day also to finish on a high.
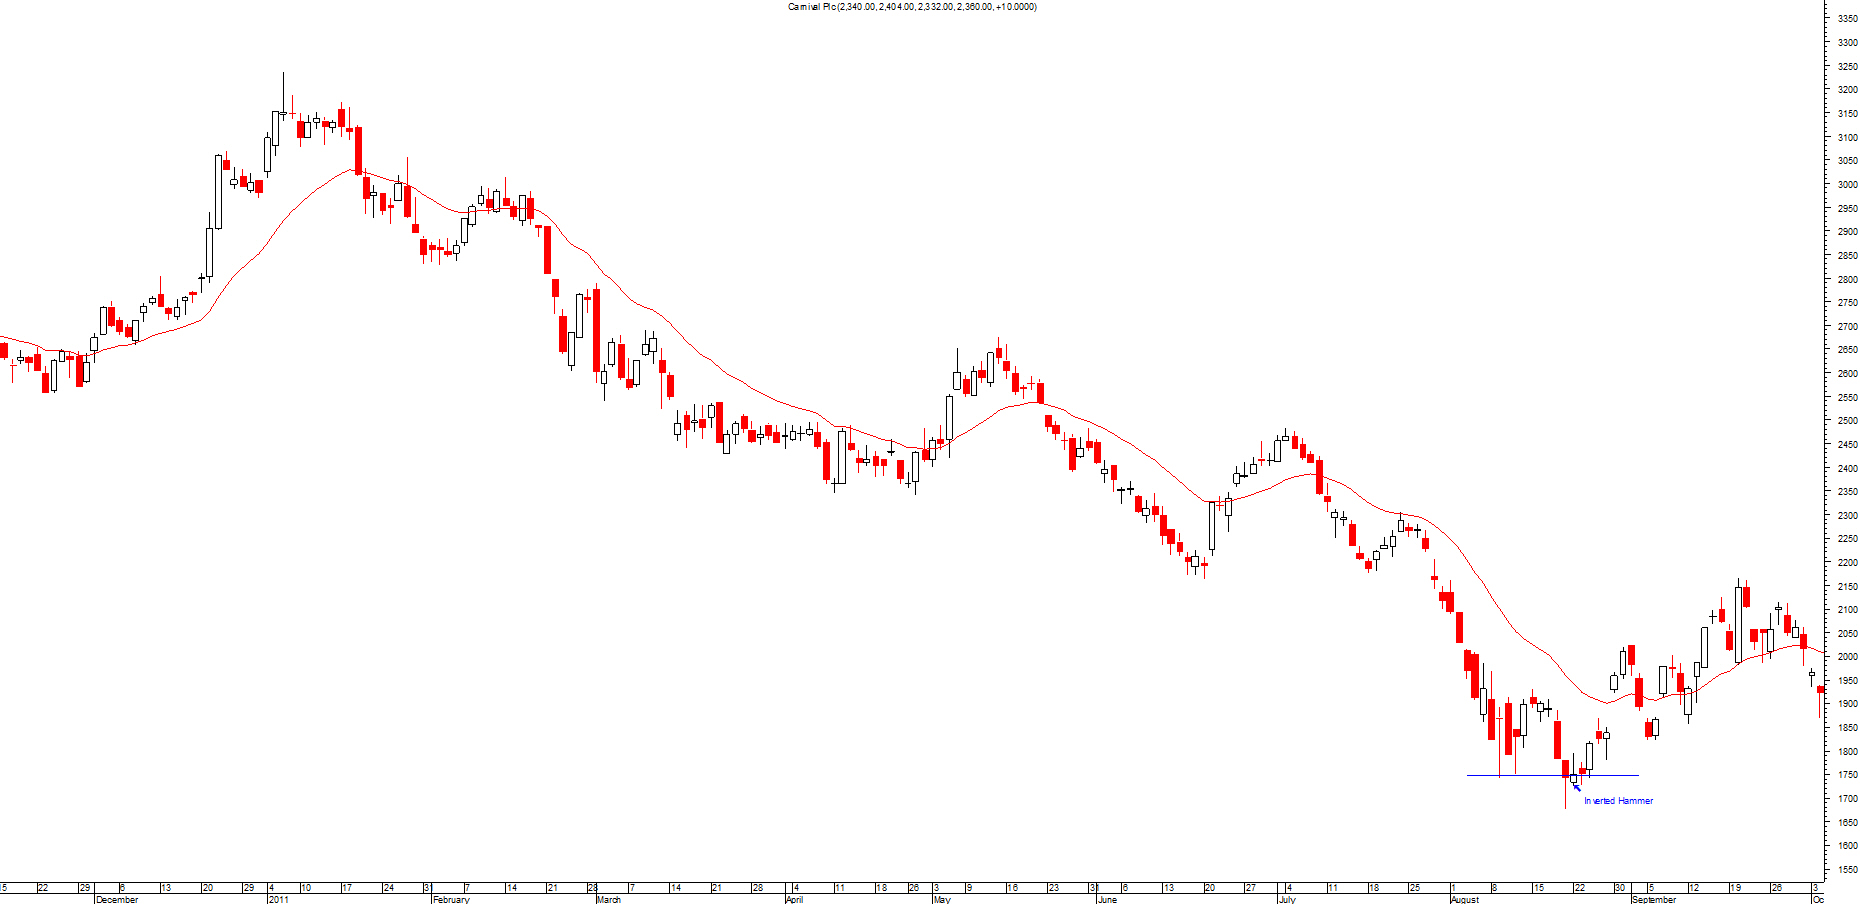
Please click on picture above to get a larger picture
Most candlestick patterns should appear close to previous resistance or support levels depending on what type it is. You should only trade a candlestick pattern if it's near these levels.
Don't trade using these patterns if it's not at the top or bottom of a trend. These patterns appear a great deal so you have to make certain you only trade at the right level.
This is very important as you will end up over trading them and you will end up losing more money than you imagined.