OBV(on balance volume)
This is one of the most popular indicators out there. This was first developed by Joseph Granville in his book called "Granville's New key to stock market profits".
OBV is constructed by total volume for each day as either a + or – depending on if it closes higher or lower for that day.
If it closes higher than the previous day then it's positive, when prices close lower than the previous day it's a negative.
This is added or subtracted from the cumulative total of each days volume.
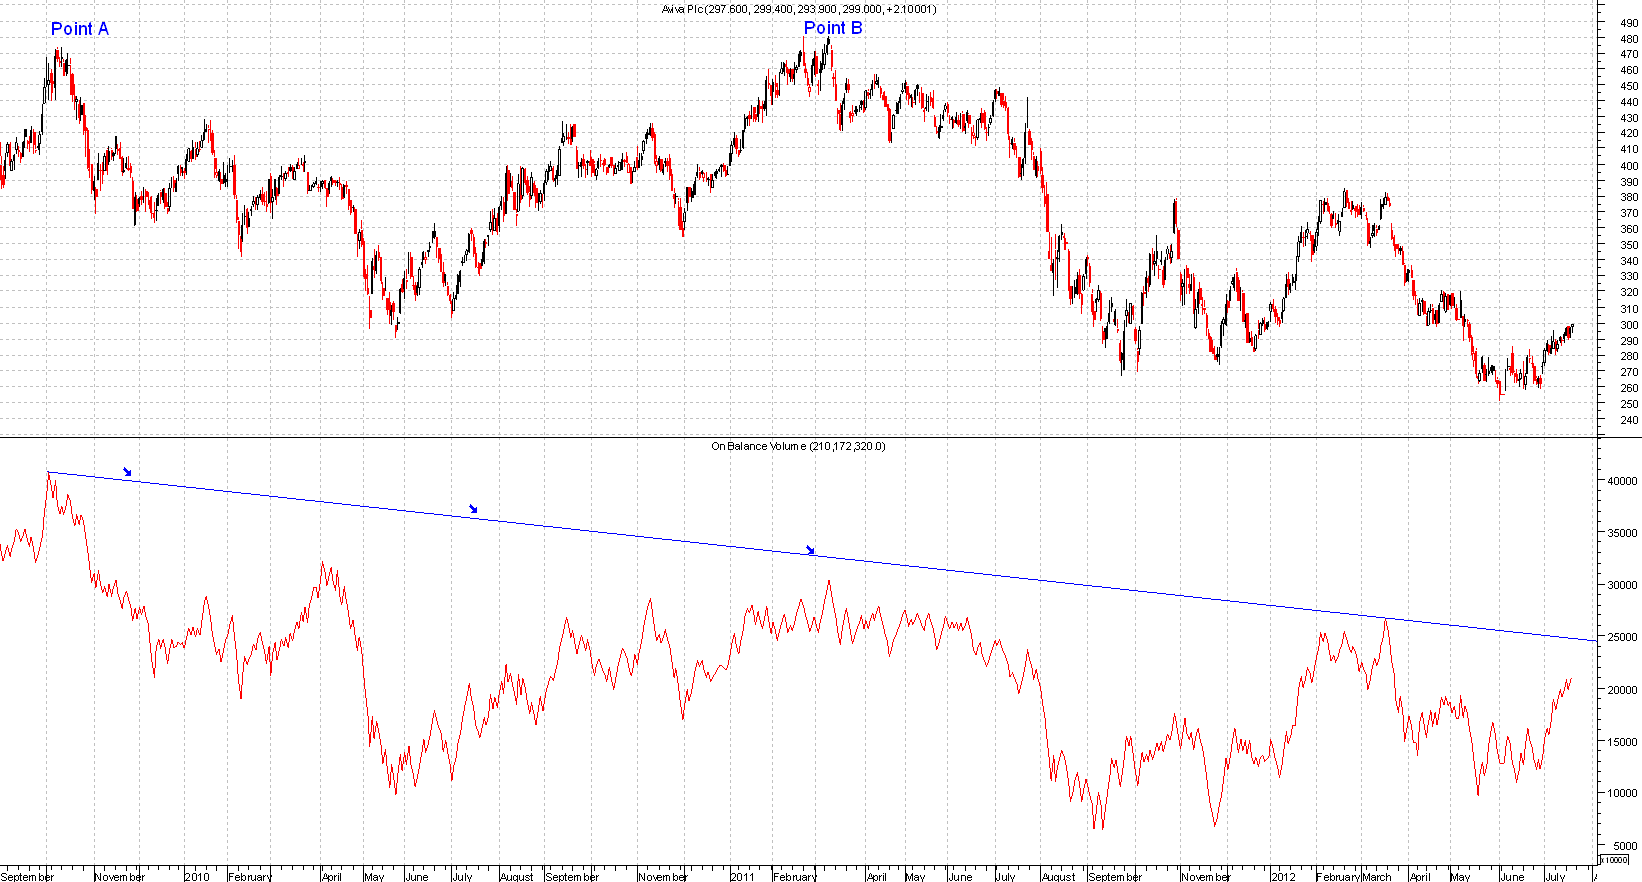
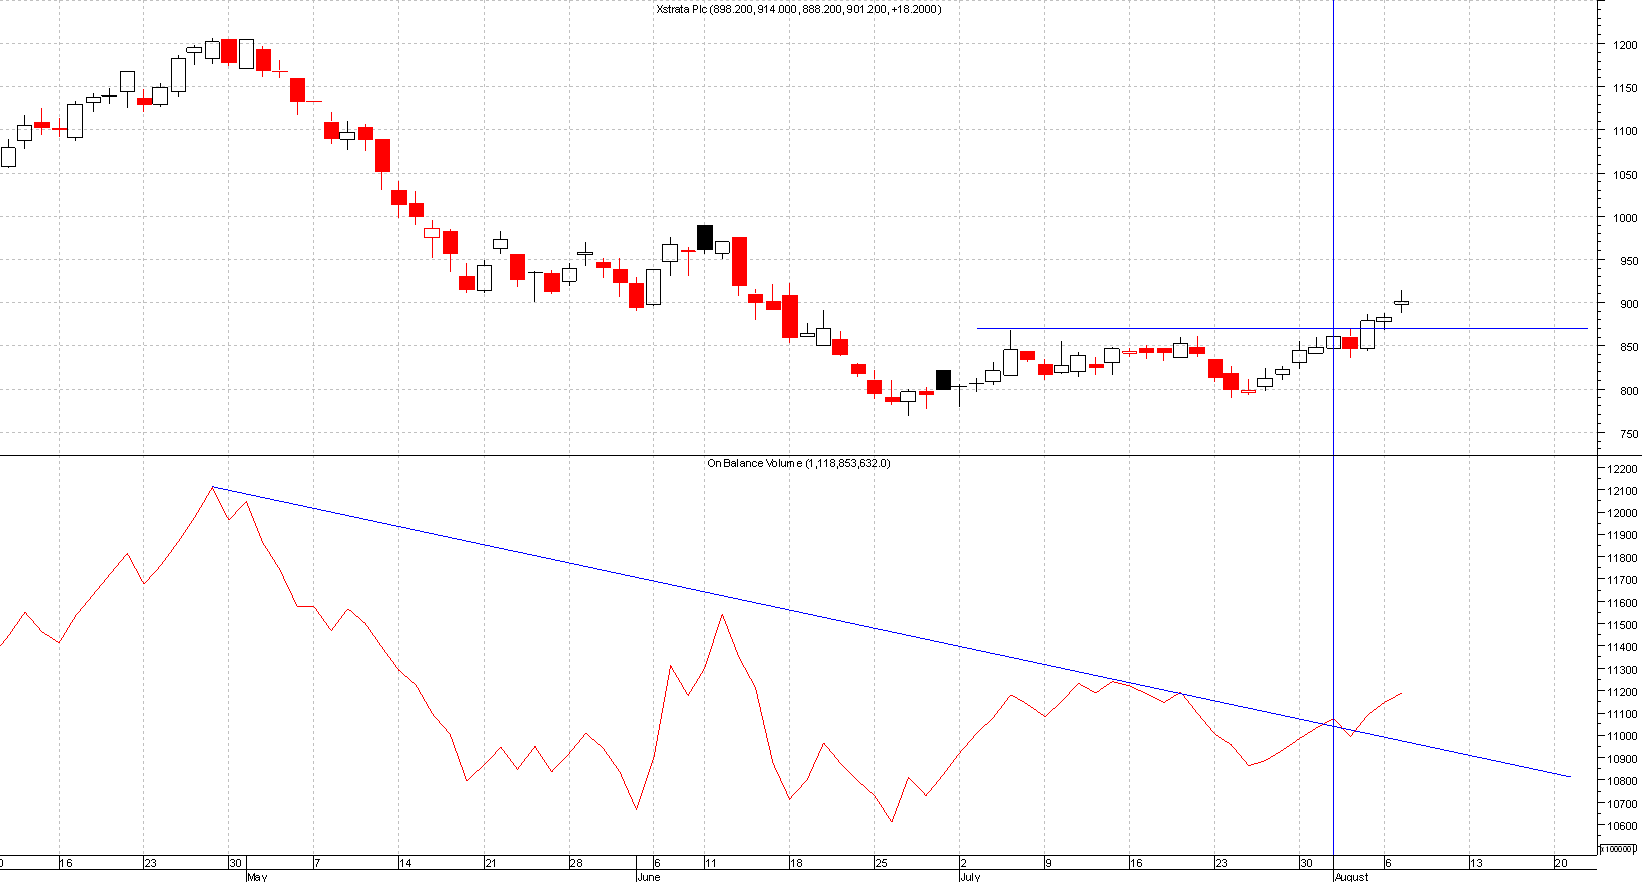
Ways to look at OBV is by drawing trend lines on OBV indicator like you would on normal charts. If prices break out of the trend line then that could give you an early indication that prices may move higher.
Please click on chart below for larger image
Another common thing to look for is divergence, if prices of the stock go higher yet OBV is going lower then that would warn of lack of interest in the buyers so new positions should not be added.
See chart below for a clear divergence, this example shows that the price rose at Point B to the same level as Point A yet OBV was nowhere near the same level as it was at point A.
So in this case the divergence helped warn of lack of buyer pressure therefore a short position or profit taking could have been used at point B.
Please click on chart below for larger image