RSI(Relative Strength Index)
This is one of the most popular indicators out there if not the most, this indicator was developed by Welles Wilder.
The most used RSI is the 14 day RSI, which is the most common time frame. It's always best to use the most commonly used time frames as the more people use it the more likely it's going to work.
The RSI is:
• Plotted on a vertical scale from 0-100.
• Below 30 is oversold - So when the RSI goes below 30 you should be looking to add longs as the shares are oversold.
• Above 70 is overbought - So when the RSI goes above 70 you should not be looking to add longs but maybe take profits or even short positions.
In a strong trending market the RSI can stay above 70 for longer periods so you need to be aware of this to.
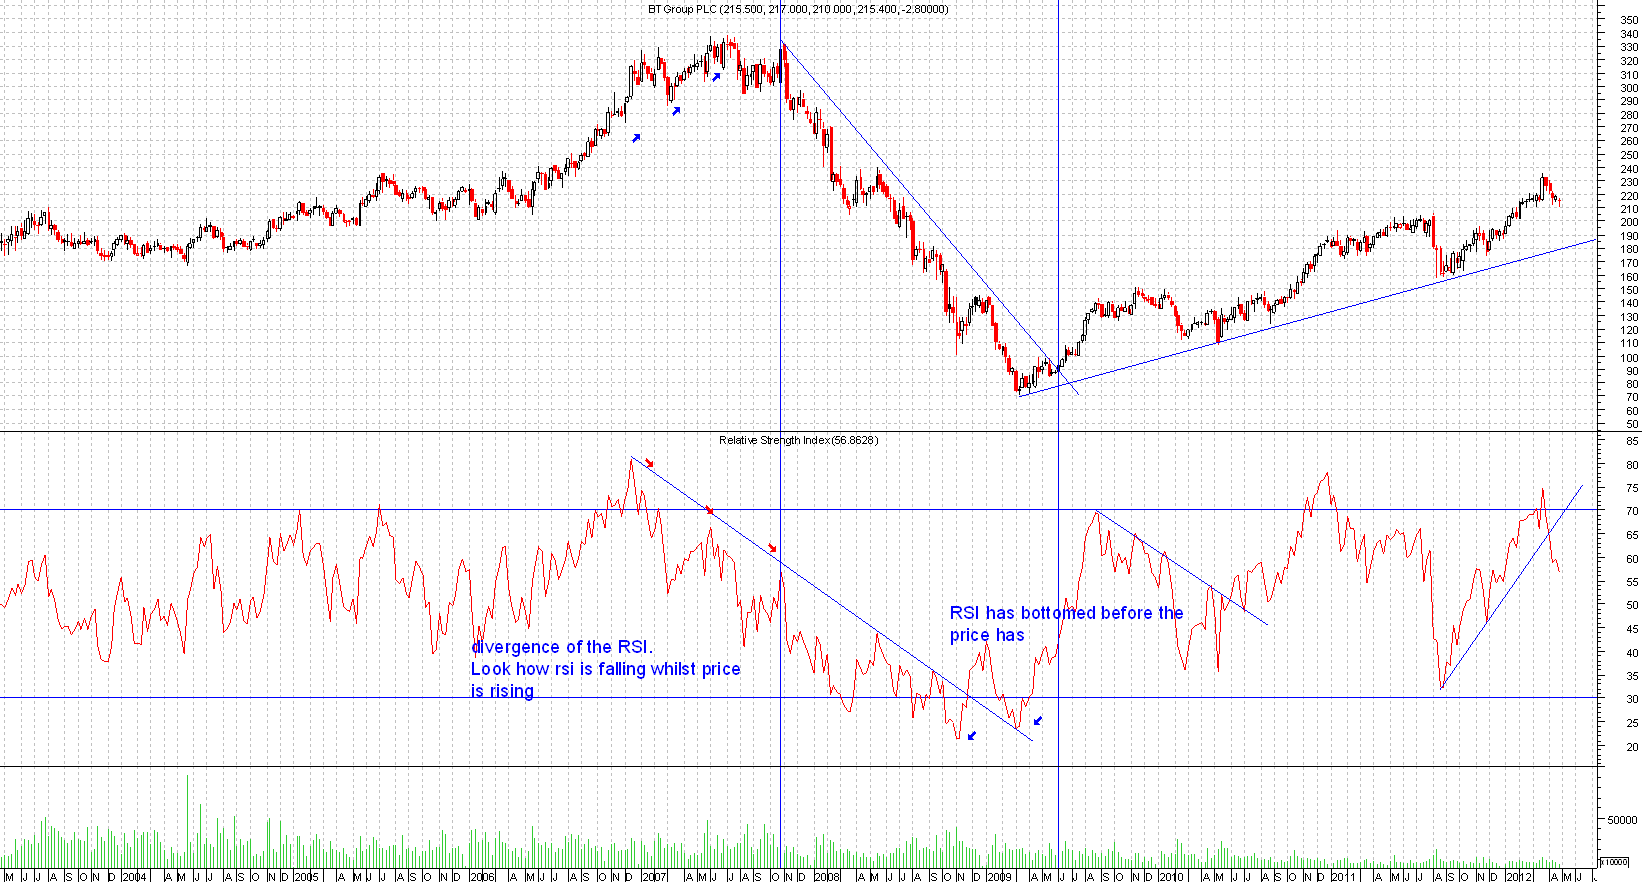
Like most indicators you can deploy trend lines to the RSI indicator and it is a good idea to look for divergence like in the example below.
Please click on chart below for larger image