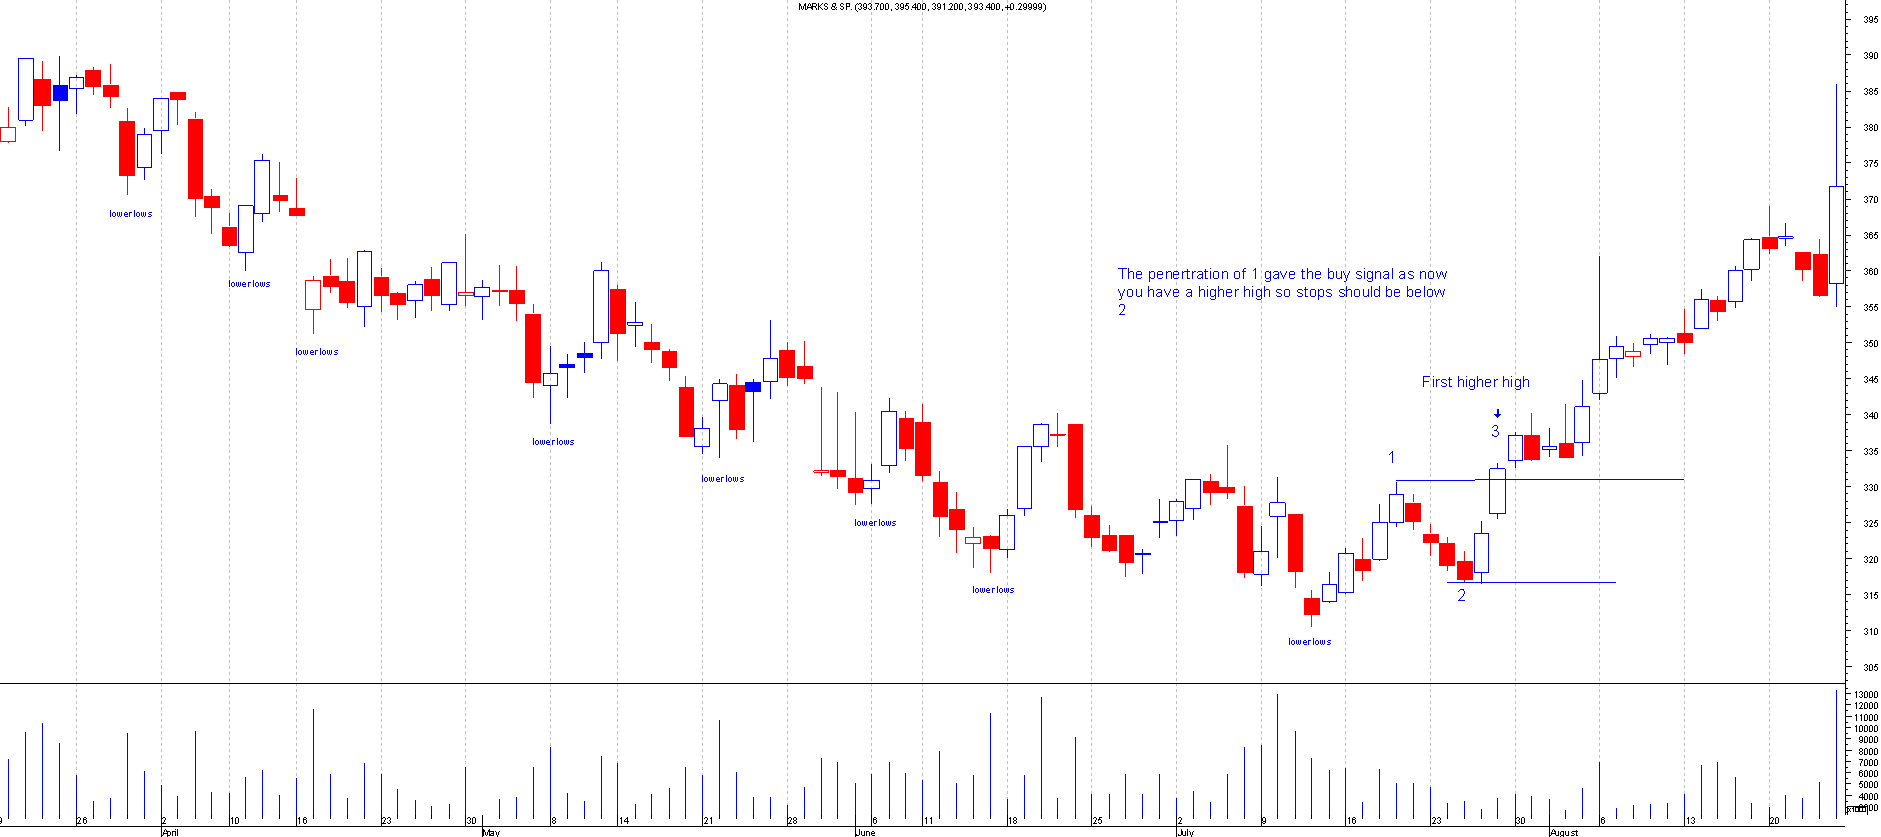
This method is a very popular method and is used to find bottoms. The way it works is, that it's looking for the end to the lower lows,
so basically waiting for the first higher highs to form.
This is best used in a down trend only, the way to draw this is that you need a low point on the chart.
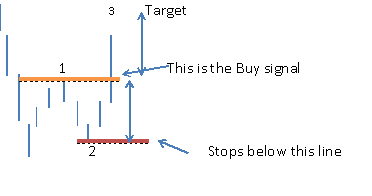
Then you wait for the price to move higher at which point you label it 1, then you wait for a retrace which should not go below the low.This you label 2
If it breaks below the low then you would have to start again. You still would not have an entry so you have lost nothing at this point.
If it does not go below the low but starts to move higher from here then you can label it 2. Now the buy signal comes once the price goes above the high of label 1, by doing so you have also got yourself a higher high.
Obviously this can be very confusing so best to look at the chart below for example:
Stops should be placed below label 2, the target could be the distance from top of 1 to the bottom of 2, which then can be projected from the breakout point.
So that is the level where you could take profits from but the bigger picture could be the fact that you may have found a possible bottom to the share so leave some positions on still.
You can get a few false signals and the best way around this is to use an indicator with it. The common indicator used is a Macd indicator and if this also has a buy signal then that gives the 123 low added confirmation.
Please click on the chart below for larger image