Articles
Doji & Long-legged Doji
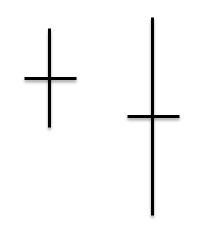
The Doji pattern is a strong indicator, it is created when the opening of the price is the same as the close of the price on a given day therefore it does not consist of a candle body.
The pattern can occur at the bottom of a downtrend or at the top of an uptrend. It is a strong indicator because it signifies that no one in the market has control, the bulls or bears are in the same position, which means that there is great uncertainty and indecision.
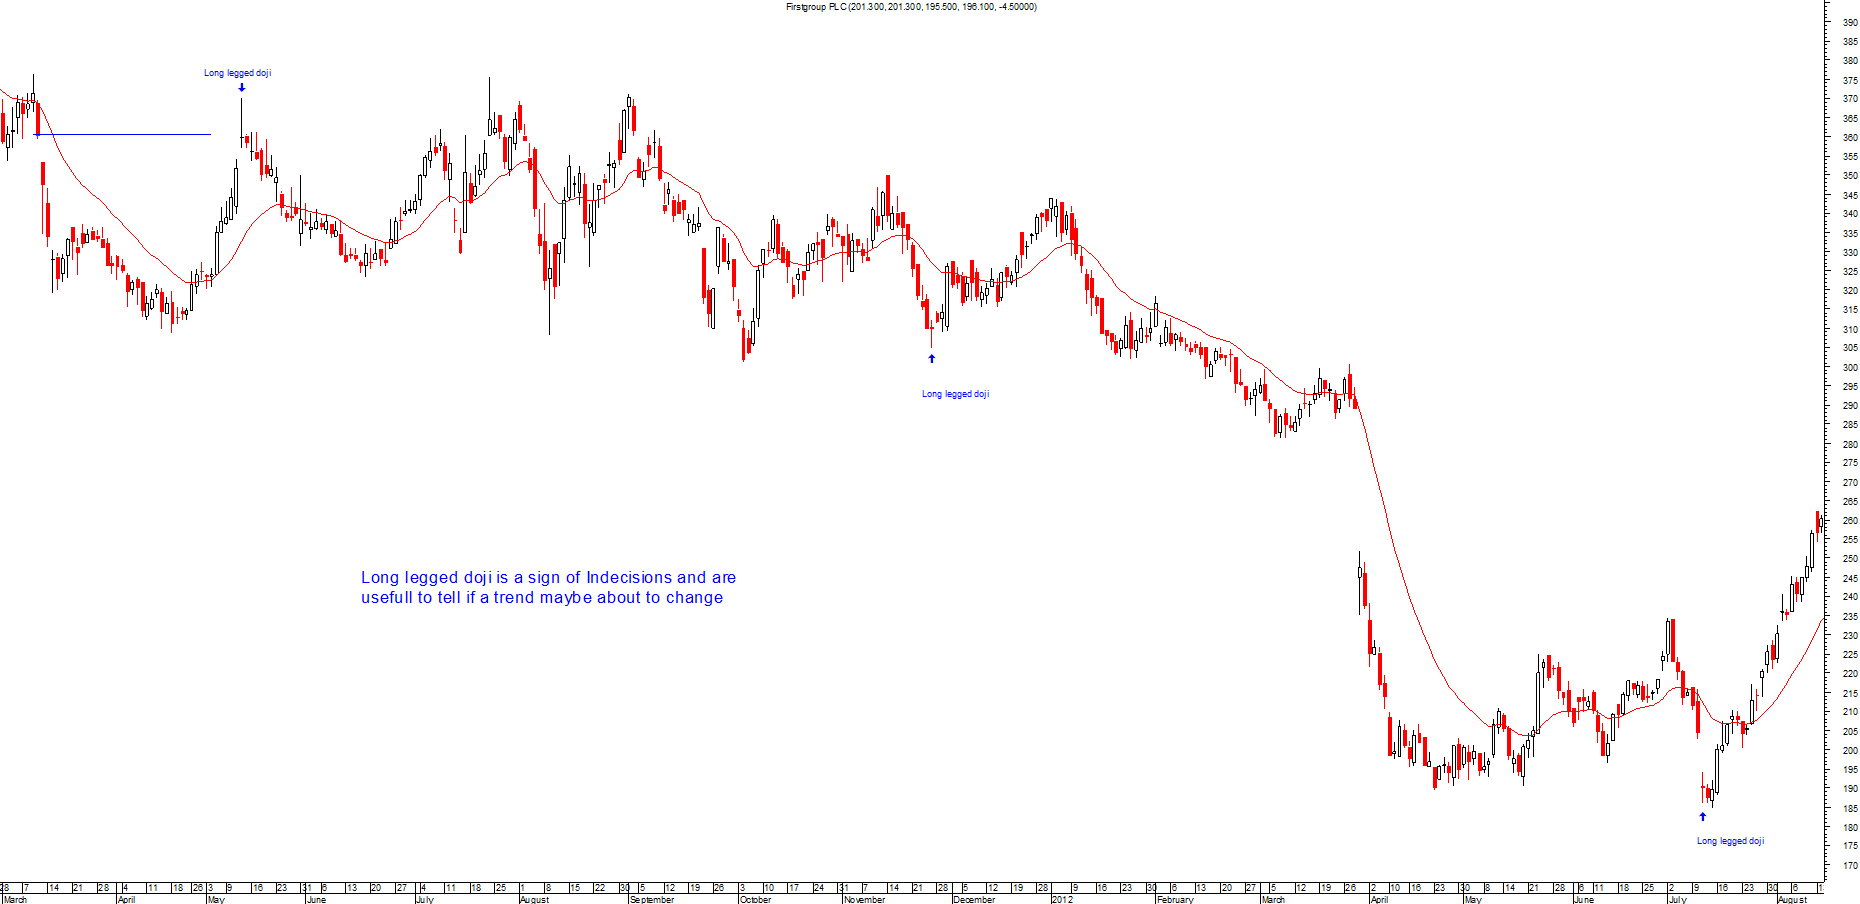
There are different types of doji patterns; one of them is called the long-legged doji. This pattern has a greater upper and lower shadow, which emphasis the indecision of traders.
Due to this uncertainty, it is thought that if the doji appears at the top of an uptrend then it could signal a bearish reversal and if it appears at the bottom of a downtrend it could signal a bullish reversal.
Please click on picture above to get a larger picture
Most candlestick patterns should appear close to previous resistance or support levels depending on what type it is. You should only trade a candlestick pattern if it's near these levels.
Don't trade using these patterns if it's not at the top or bottom of a trend. These patterns appear a great deal so you have to make certain you only trade at the right level.
This is very important as you will end up over trading them and you will end up losing more money than you imagined.