With regard to price data in the market there is always going to be fluctuations or noise, moving averages is a method commonly used in technical analysis to help reduce these fluctuations and smooth the price movement. By smoothing out these fluctuations moving averages help to define and clarify a trend and therefore makes the trend much clearer to read and interpret.
This method uses closing market prices and time periods to calculate the moving average therefore you could have a 10-day moving average or a 200-day moving average depending on what time period you have chosen. However, a 10-day moving average would have more fluctuations then a 200-day moving average due to the amount of data available.
One important thing to note about moving averages is that this method has a lag because it is not based on current prices but past prices. Therefore, although the moving average moves with the price it does not predict future prices but it highlights the direction a trend is moving.
The uses of moving averages include highlighting trends that are forming and because they move with the prices they can also be used as support and resistances levels on a chart.
There are many types of moving averages you can calculate including simple, exponential and weighted; the most commonly used are simple and exponential.
Simple Moving Average (SMA):
The simple moving average like its name is the simplest average and is calculated by the sum of the closing prices divided by the number of time periods. The moving average moves with the price because as the price moves on each day it drops the oldest price and adds the newest price to the calculation.
Let's look at an example; this is from the company Microsoft:
10-Day Simple Moving Average Calculation:
(29.49 + 28.64 +28.00 + 28.04 + 27.90 + 27.88 + 28.21 + 28.54 + 29.51 + 29.49) / 10 = 28.57
|
Day |
Price |
10-Day Simple Moving Average |
|
1 |
29.49 |
|
|
2 |
28.64 |
|
|
3 |
28.00 |
|
|
4 |
28.04 |
|
|
5 |
27.90 |
|
|
6 |
27.88 |
|
|
7 |
28.21 |
|
|
8 |
28.54 |
|
|
9 |
29.51 |
|
|
10 |
29.49 |
28.57 |
|
11 |
29.63 |
28.584 |
|
12 |
29.86 |
28.706 |
|
13 |
29.08 |
28.814 |
|
14 |
28.81 |
28.891 |
|
15 |
28.83 |
28.984 |
|
16 |
28.22 |
29.018 |
|
17 |
27.08 |
28.905 |
|
18 |
26.84 |
28.735 |
|
19 |
26.66 |
28.45 |
|
20 |
26.52 |
28.153 |
Chart Example:
Let's look at a chart example; this chart shows 3 different simple moving averages:
Red – 10-day SMA
Green – 50-day SMA
Blue – 200-day SMA
(Please click on chart below to make bigger)
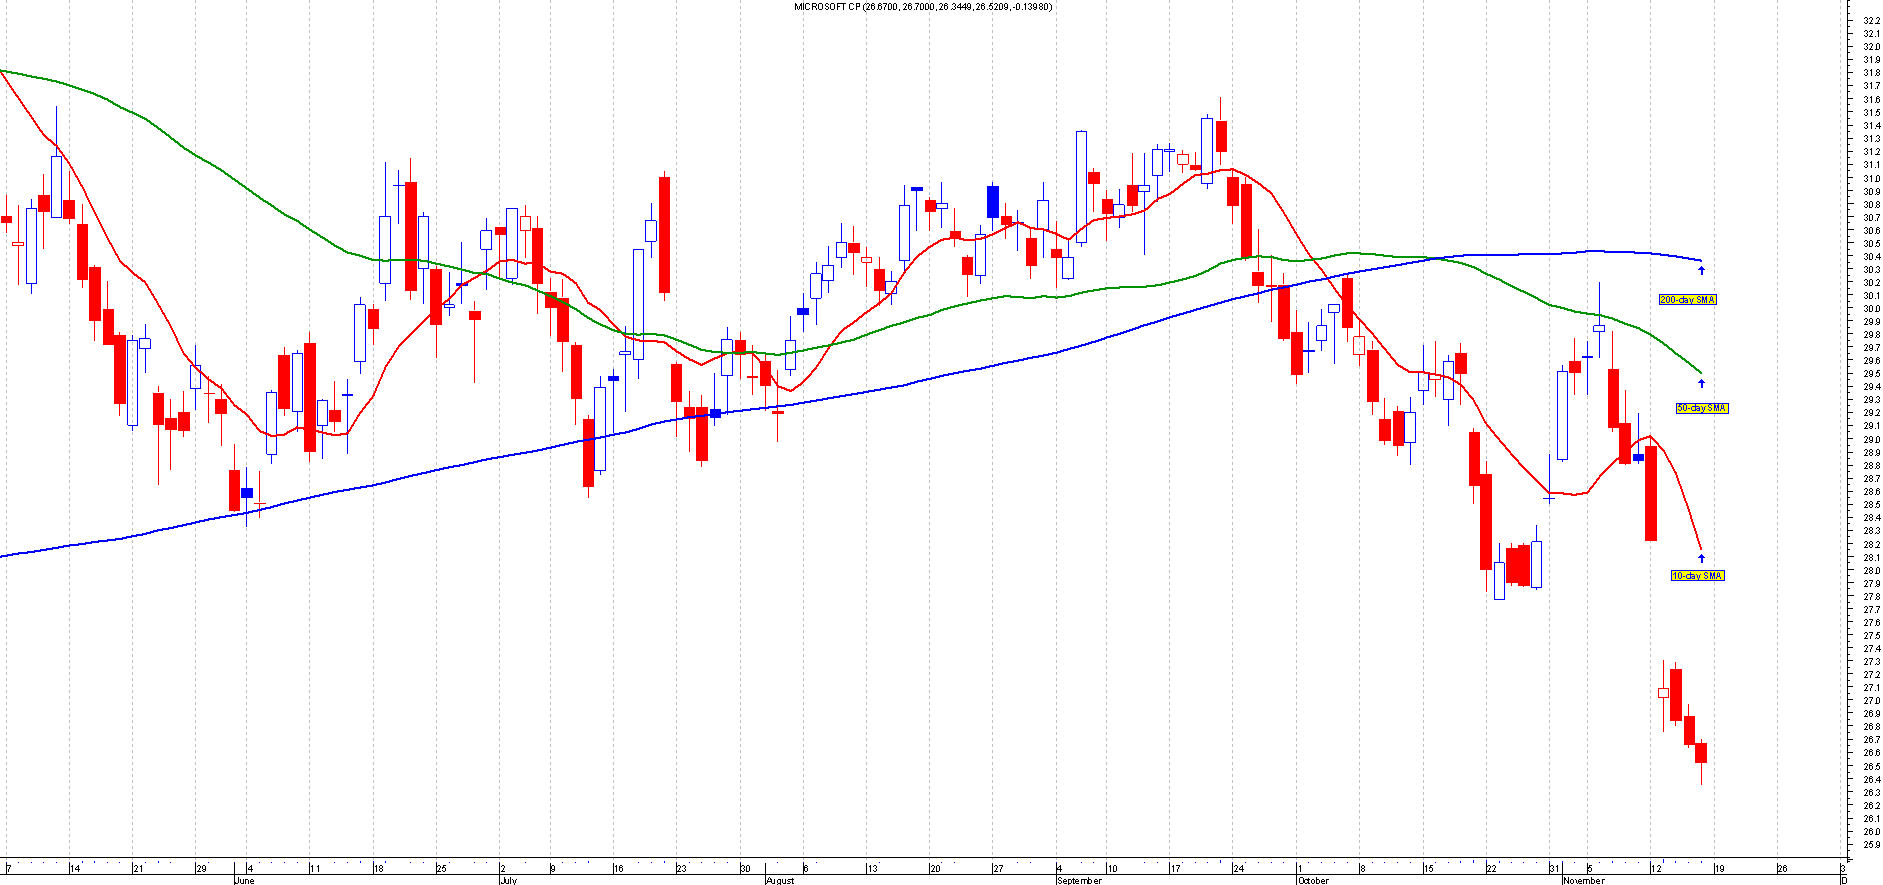
As you can see from the chart, the 10-day average is much faster to react and closely follows the movement of the price. The 50-day average is slight slower to react but the 200-day moving average is very slow and does not match the price movement.
This is because the longer the time period the more data and then subsequently the more lag the average has.
Weighted Moving Average (WMA)
The weighted moving average instead of treating all prices as equal like SMA, as suggested by its name it adds weight to the most current prices rather than the old prices; it does this by multiplying each price by a weight factor and then reducing the weight by 1 for each of the previous prices. This result is then divided by the sum of the number of time periods.
10-Day Weighted Moving Average Calculation:
((10*29.49) + (9*29.51) + (8*28.54) + (7*28.21) + (6*27.88) + (5*27.90) + (4*28.04) + (3*28.00) + (2*28.64) + (1*29.49)) / (10+9+8+7+6+5+4+3+2+1) = 28.652
|
Day |
Price |
10-Day Weighted Moving Average |
|
1 |
29.49 |
|
|
2 |
28.64 |
|
|
3 |
28.00 |
|
|
4 |
28.04 |
|
|
5 |
27.90 |
|
|
6 |
27.88 |
|
|
7 |
28.21 |
|
|
8 |
28.54 |
|
|
9 |
29.51 |
|
|
10 |
29.49 |
28.652 |
|
11 |
29.63 |
28.847 |
|
12 |
29.86 |
29.079 |
|
13 |
29.08 |
29.147 |
|
14 |
28.81 |
29.146 |
|
15 |
28.83 |
29.135 |
|
16 |
28.22 |
28.996 |
|
17 |
27.08 |
28.644 |
|
18 |
26.84 |
28.269 |
|
19 |
26.66 |
27.891 |
|
20 |
26.52 |
27.540 |
Exponential Moving Average (EMA)
The exponential moving average is similar to the weighted moving average as it adds more weight to the most current prices rather than the old prices; however the weight is reduced exponentially for each of the previous prices.
To calculate this moving average you would need the weighting, the previous EMA and the most recent closing price. A note to remember is that with the first calculation because we don't have a previous EMA we use the first simple moving average.
10-Day Exponential Moving Average Calculation:
Weighting: (2 / (10+1)) = 0.1818
EMA = 28.57
Closing price=29.63
EMA = (29.63 * 0.1818) + (28.57 * (1-0.1818)) = 28.762
|
Day |
Price |
10-Day Exponential Moving Average |
|
1 |
29.49 |
|
|
2 |
28.64 |
|
|
3 |
28.00 |
|
|
4 |
28.04 |
|
|
5 |
27.90 |
|
|
6 |
27.88 |
|
|
7 |
28.21 |
|
|
8 |
28.54 |
|
|
9 |
29.51 |
|
|
10 |
29.49 |
28.57 |
|
11 |
29.63 |
28.762 |
|
12 |
29.86 |
28.961 |
|
13 |
29.08 |
28.982 |
|
14 |
28.81 |
28.950 |
|
15 |
28.83 |
28.928 |
|
16 |
28.22 |
28.799 |
|
17 |
27.08 |
28.486 |
|
18 |
26.84 |
28.186 |
|
19 |
26.66 |
27.908 |
|
20 |
26.52 |
27.605 |
Chart Example:
Let's look at a chart example; this chart shows a 10-day moving average of all types:
Red = SMA
Green=WMA
Blue= EMA
(Please click on chart below to make bigger)
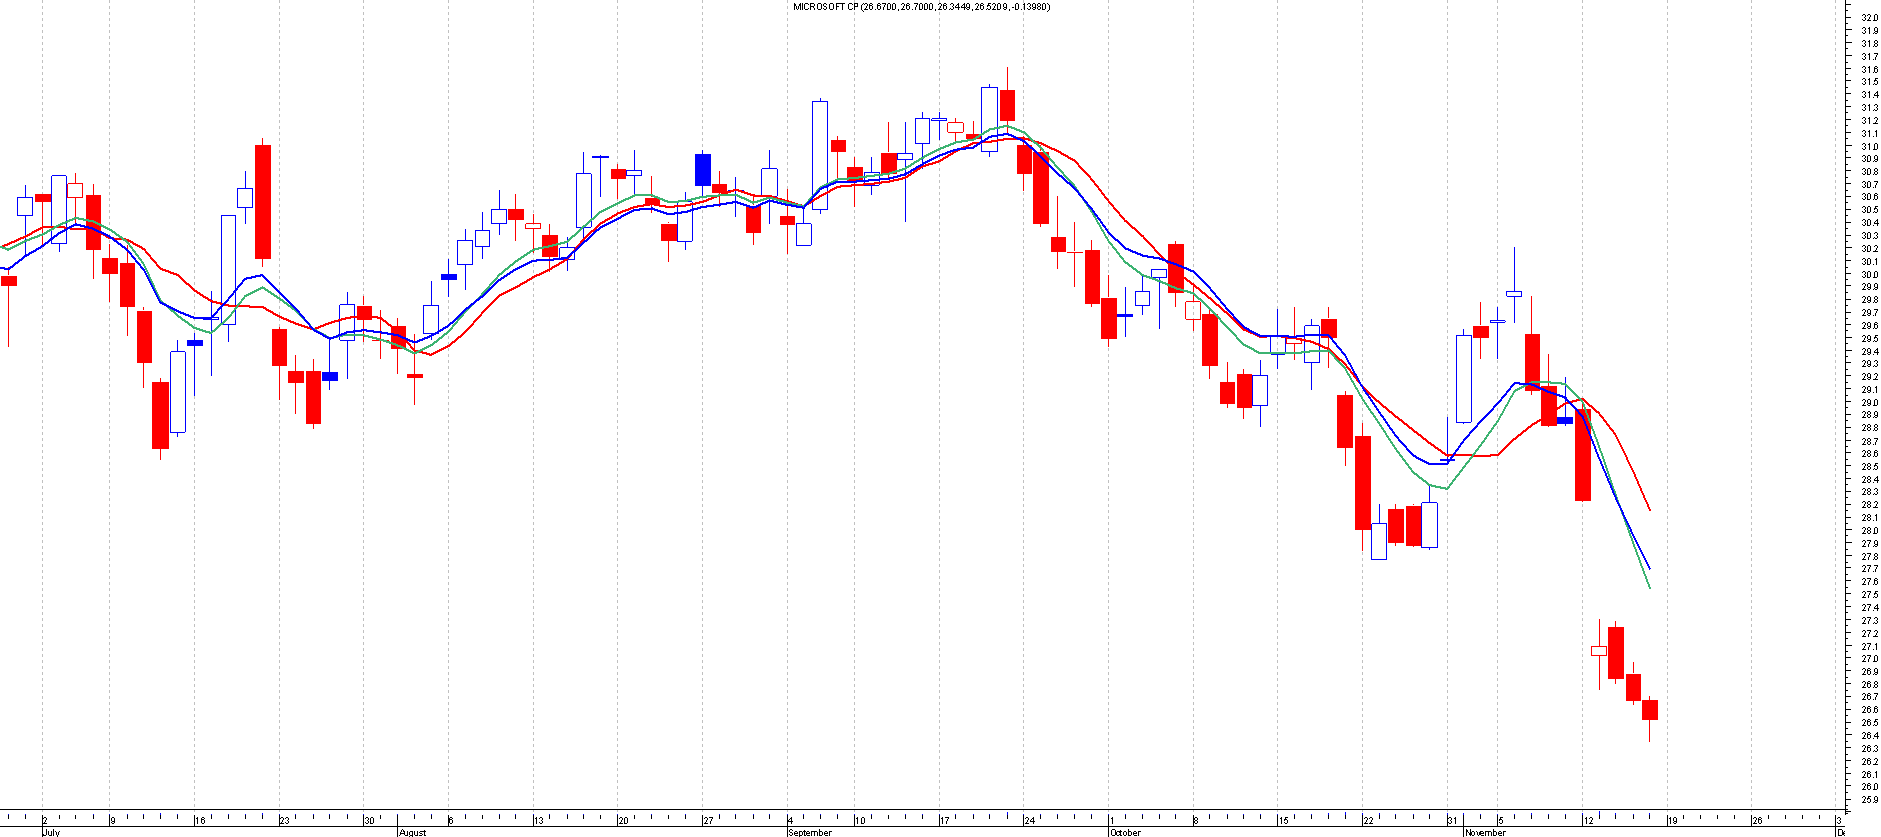
From this chart you can notice that the SMA is more slower compared to the other averages, it takes more time to react to the price changes and therefore it could be argued that it is less effective than the other averages.
The weighted moving average is faster to react to price movement and this is shown in the chart. It mirrors the movement of the prices more accurately compared to the simple moving average.
However, the exponential moving average has much less lag then the other averages and therefore is the faster to react to price movement.
The advantage of using moving averages is that it helps to reduce fluctuations and smooth the price therefore making the trend much clearer to see and understand. Rather than just relying solely on the price of the market it provides a good indicator of how the market is trending.
Another way to use moving averages is by using them as support and resistance levels. Once you plot them on a chart they can highlight the support and resistance areas but one thing to note is that these support and resistance levels are dynamic and will always be changing unlike the traditional method.
There are many other types of averages out there but no one is better than the other, as it all depends on what you want to gain from the average. If you want an average that is fast to react to prices then you would use an EMA however the disadvantage of using EMA is that as it is very fast, you may think that it is defining a trend but it could be just a false signal.
If you wanted to see the overall trend then you could use the SMA, it is slower and averages out the entire time period and smoothes out the price greatly. However, the disadvantage of using a SMA is that because it's slow you could potentially miss out on a lot of opportunities.
It is recommended that when using moving averages the best thing to do is to use more than one on your chart, this way it gives you more information and gives you a clearer picture of what is happening in the market.