It has been a busy few months. Since our last blog post in May we have rebuilt ChartsView from top to bottom and added a long list of new pages and tools, all free. If you have not been on the site for a while, this is your quick tour of what is new and where to find it.
A fresh new look
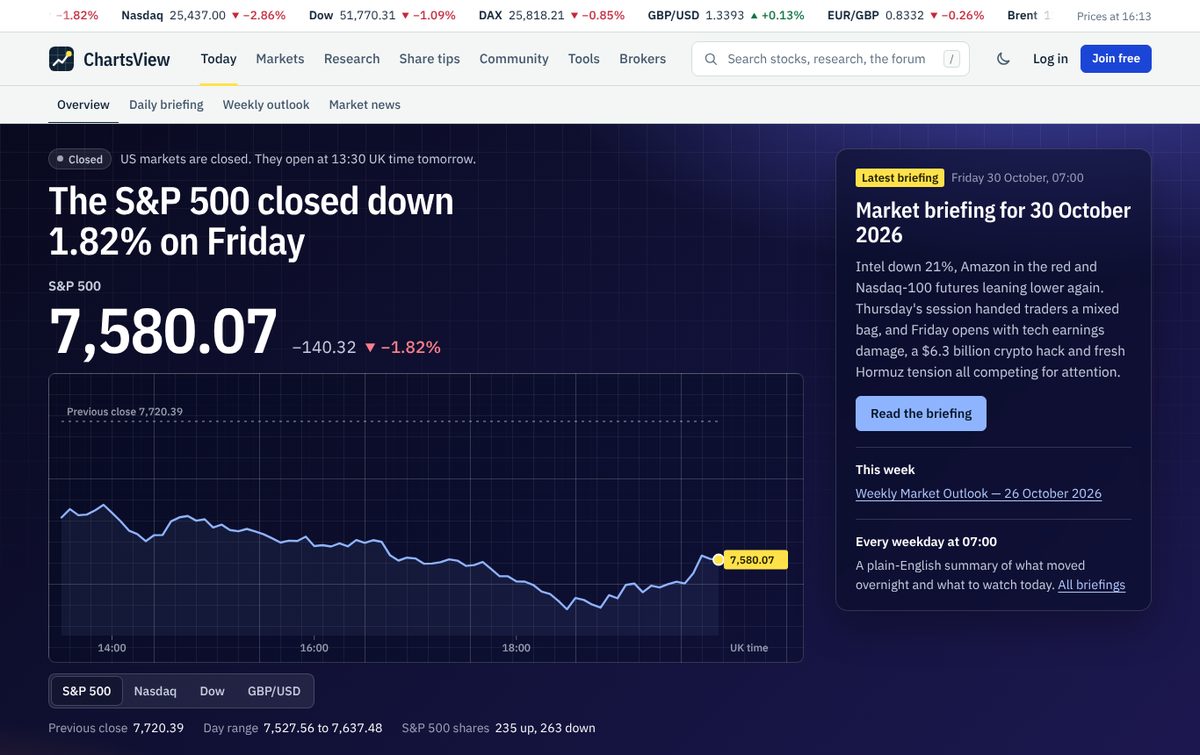
The whole site has a new design. Each section of the menu has its own colour, so you always know where you are, and there is a dark mode switch (the moon at the top of every page) for early mornings and late nights. A scrolling price strip across the top shows the S&P 500, Nasdaq, Dow, DAX, the main currency pairs, oil and gold.
The home page now opens with a plain-English summary of how the US market did, a live chart of the S&P 500, the latest daily briefing and the biggest movers, so you can see what matters in a few seconds.
Company trackers for 38 big names
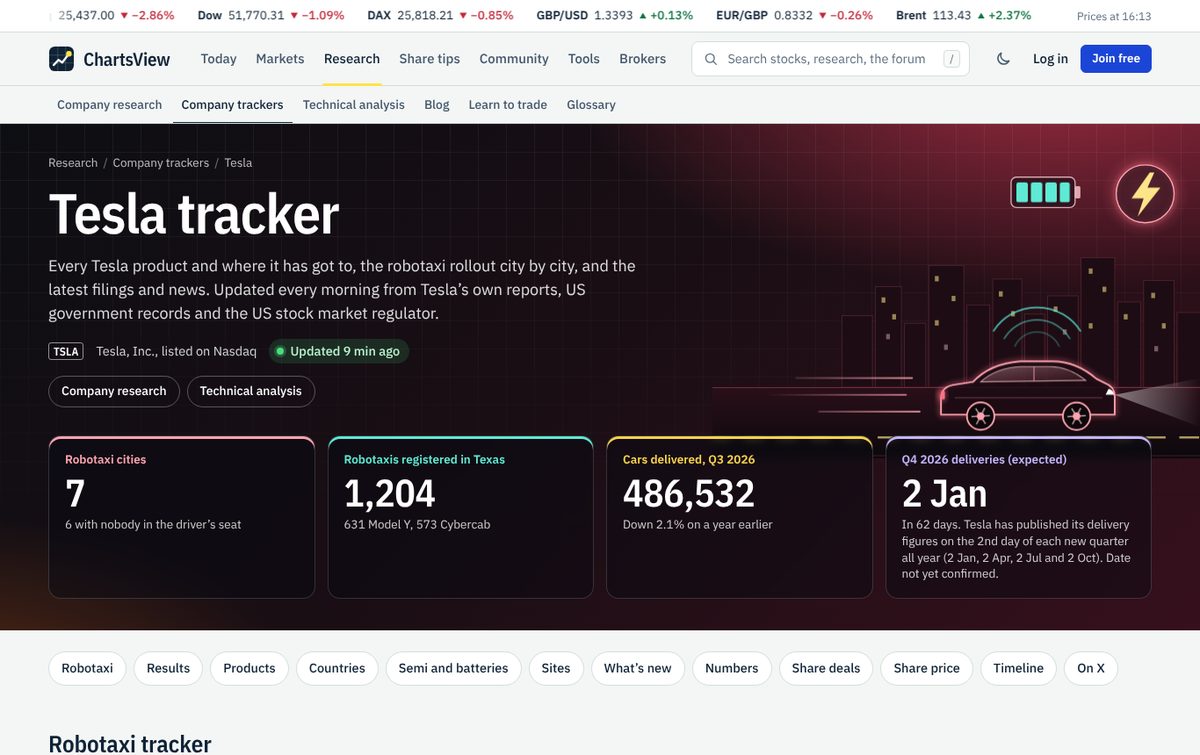
This is the biggest new feature. Company trackers follow 38 of the most talked-about companies, including Tesla, SpaceX, Nvidia, Apple, Microsoft, Amazon, Alphabet, Meta and Palantir. Each page shows every product and how far along it is, sales by product, the latest results against what analysts expected, share buybacks and dividends, company news and posts on X.
Where free public data exists, we track it live:
- Tesla: robotaxi cities and the number of robotaxis registered in Texas, updated through the day.
- SpaceX and Rocket Lab: launches, past and upcoming.
- Netflix: its weekly global Top 10.
- Palantir: new US government contracts.
- Ford: vehicle recalls.
- AST SpaceMobile: its satellites in orbit.
The trackers refresh every hour, and when a company reports, its page gets a summary of the results.
Company research and technical analysis
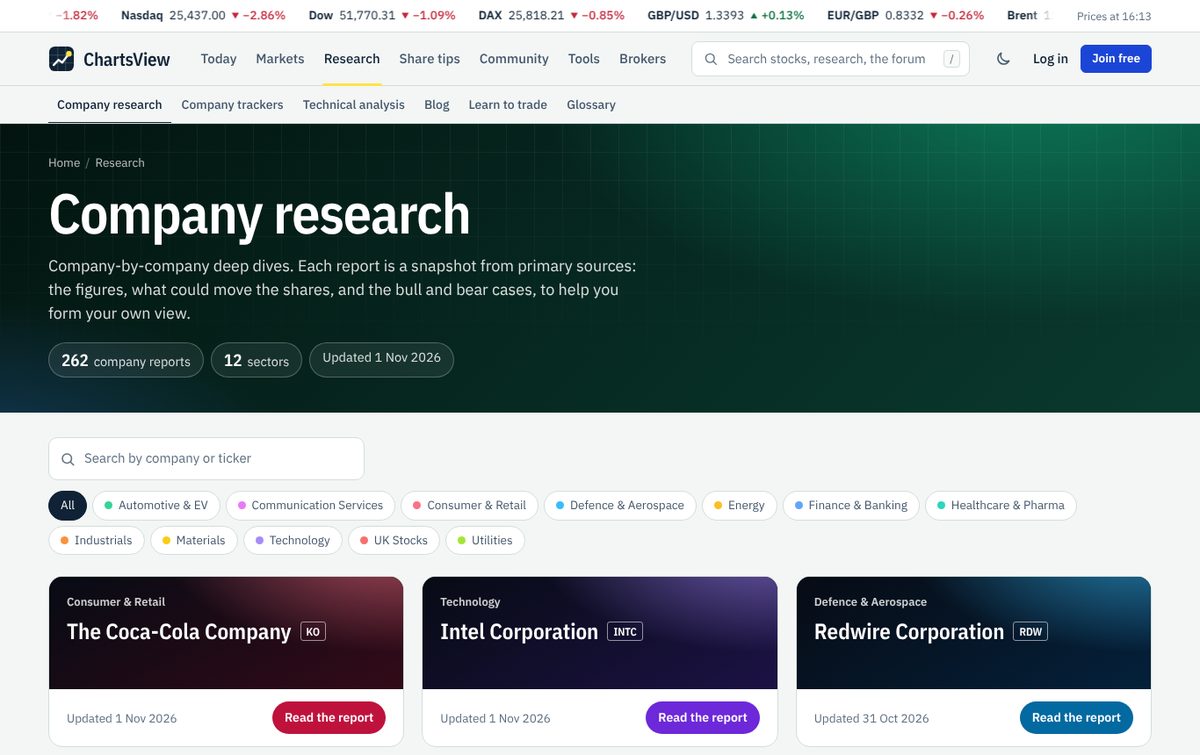
Company research now has more than 260 reports across 12 sectors. Each one covers what the business does, its sales and profits, its balance sheet, the bull and bear case, the risks and the key dates coming up. They are built from the companies' own filings and contain no analyst ratings or price targets, so you can form your own view.
Technical analysis pages give a read on trend, key levels and momentum for shares and the main indices.
A market briefing every weekday
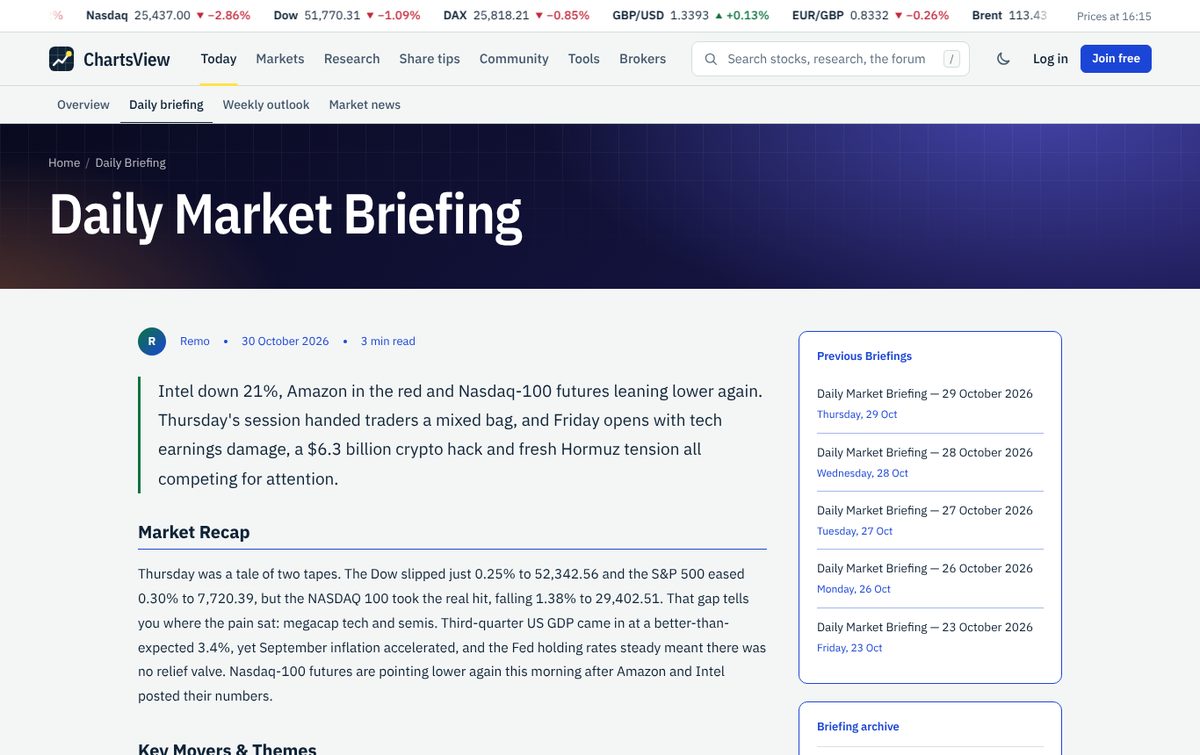
The daily market briefing is published at 7am every weekday: what moved overnight, why, and what to watch today, in plain English. Every Monday the weekly outlook sets out the week ahead. You can now browse every past briefing month by month from the briefing archive on the briefing page.
New market pages
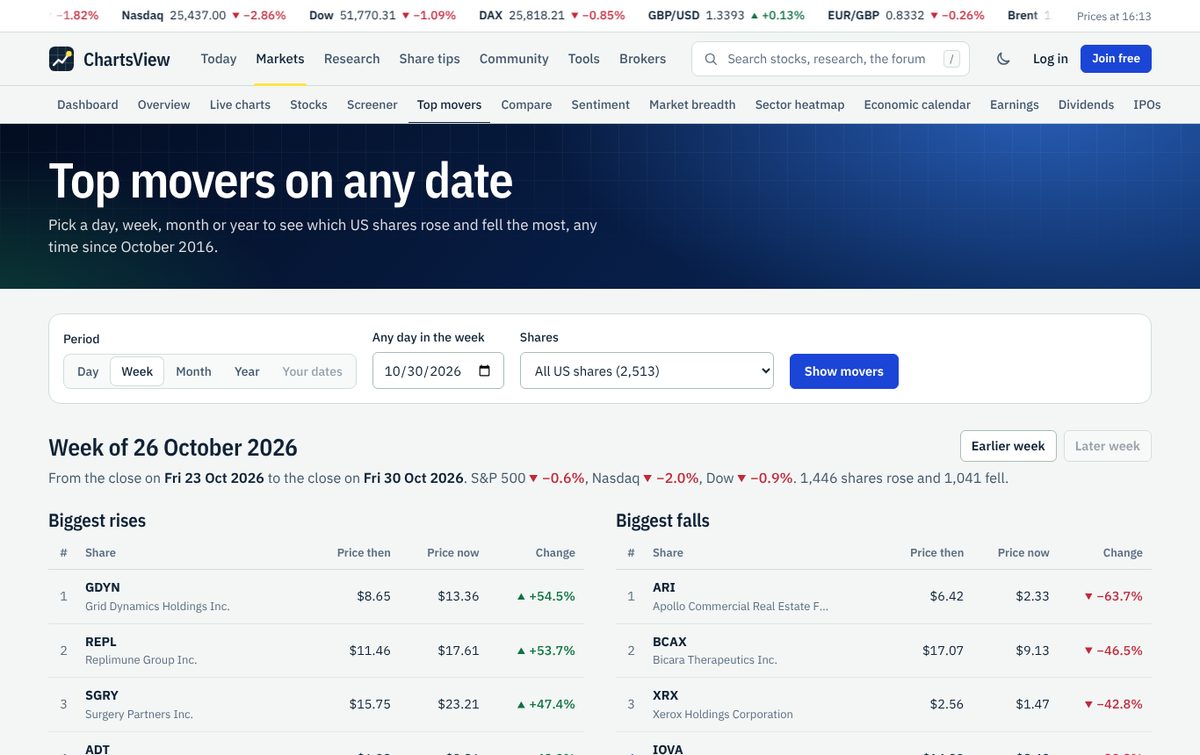
- Top movers: the biggest rises and falls among more than 2,500 US shares for any day, week, month or year back to October 2016.
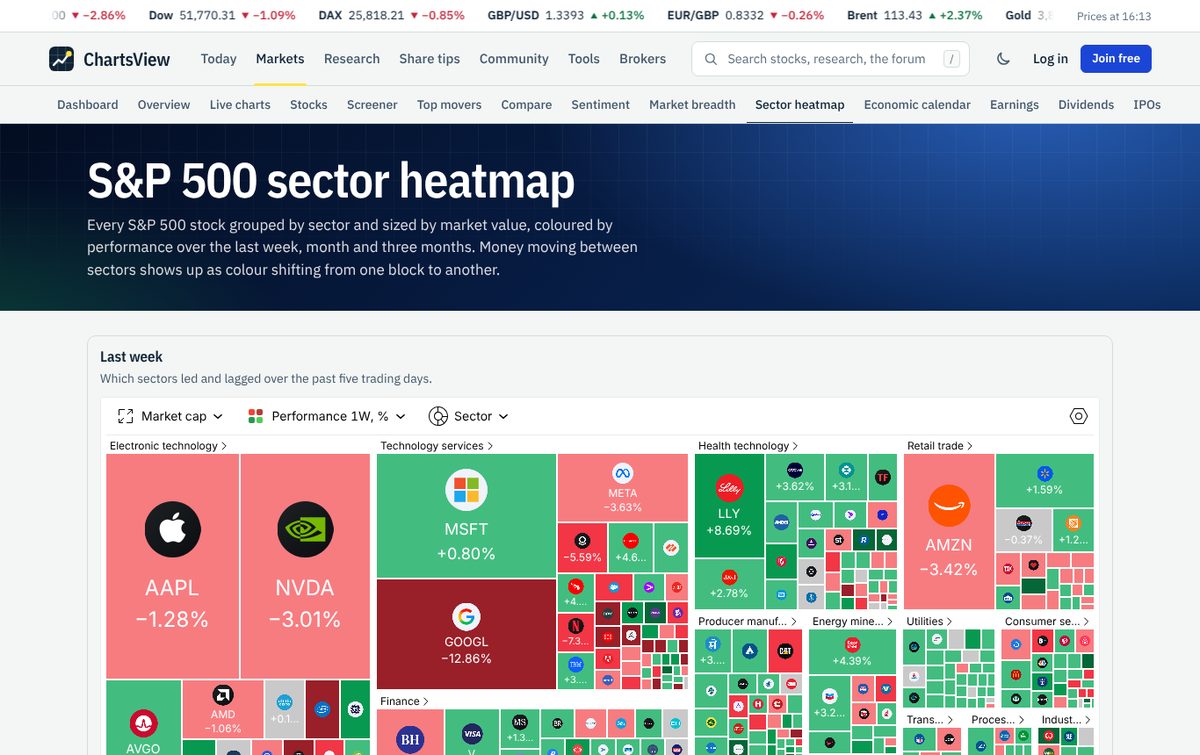
- Sector heatmap: every S&P 500 share grouped by sector and coloured by how it has done over the last week, month and three months, so you can see where money is moving.
- Market breadth: how many S&P 500 shares are above their key moving averages, a quick way to see whether a rally is broad or narrow.
- Risk flags: the economic releases most likely to move US30, NAS100 and DE40, with dates.
- Earnings, dividend and IPO calendars for US shares.
Free trading tools and UK tax calculators
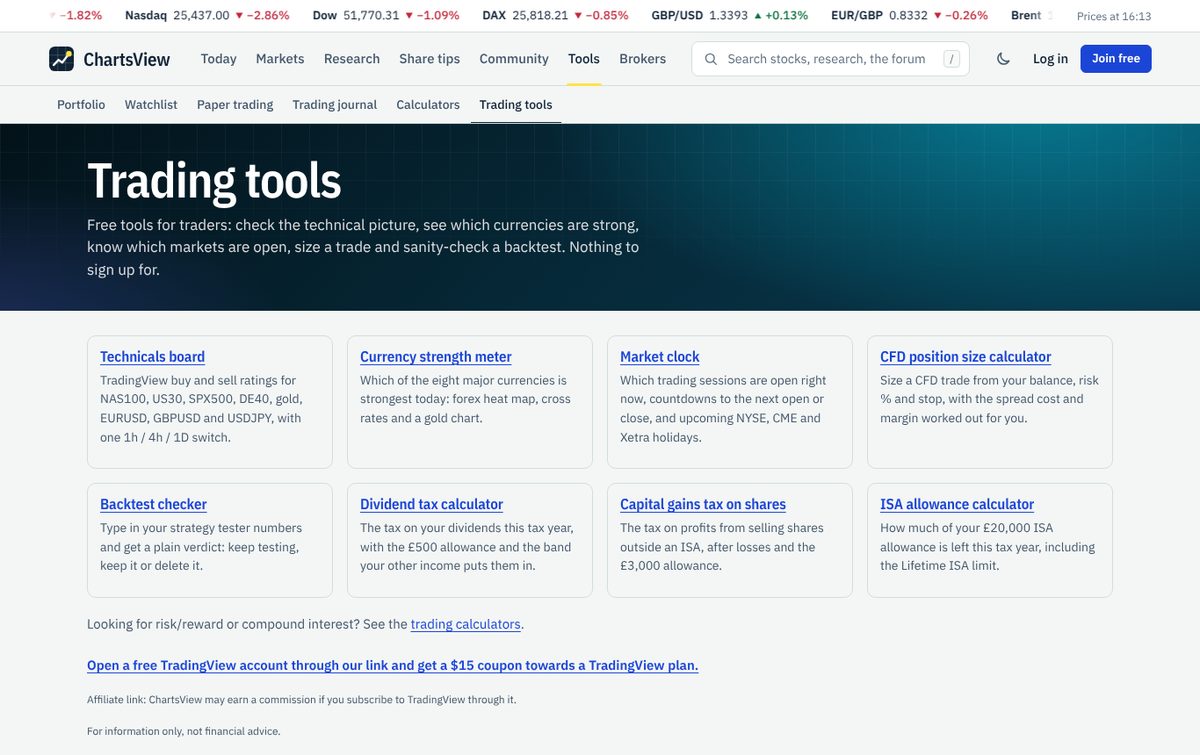
The new trading tools page brings together eight free tools:
- Technicals board: buy and sell readings for the main indices, currencies and gold across timeframes.
- Currency strength meter: which of the eight major currencies are strongest today.
- Market clock: which markets are open now, with countdowns to the next open and close.
- CFD position size calculator and backtest checker.
- UK tax calculators for dividend tax, capital gains tax and your ISA allowance, using this tax year's figures.
The calculators page still has the position size, risk/reward and compound interest calculators.
For members: paper trading, share tips and more
Membership is free and unlocks the tools you use with your own account:
- Paper trading: practise with £10,000 of virtual money at real US share prices. Each share shows a chart and key figures before you buy, and your account shows today's profit or loss, with the currency effect split out.
- Share tips: post a tip with an entry, a target and a stop, and it is tracked live until it hits one of them. Visitors can now see the results so far and the best calls.
- Portfolio tracker, watchlist and trading journal. Watchlist users also get a short Sunday email with how their shares did that week.
ChartsView on your phone
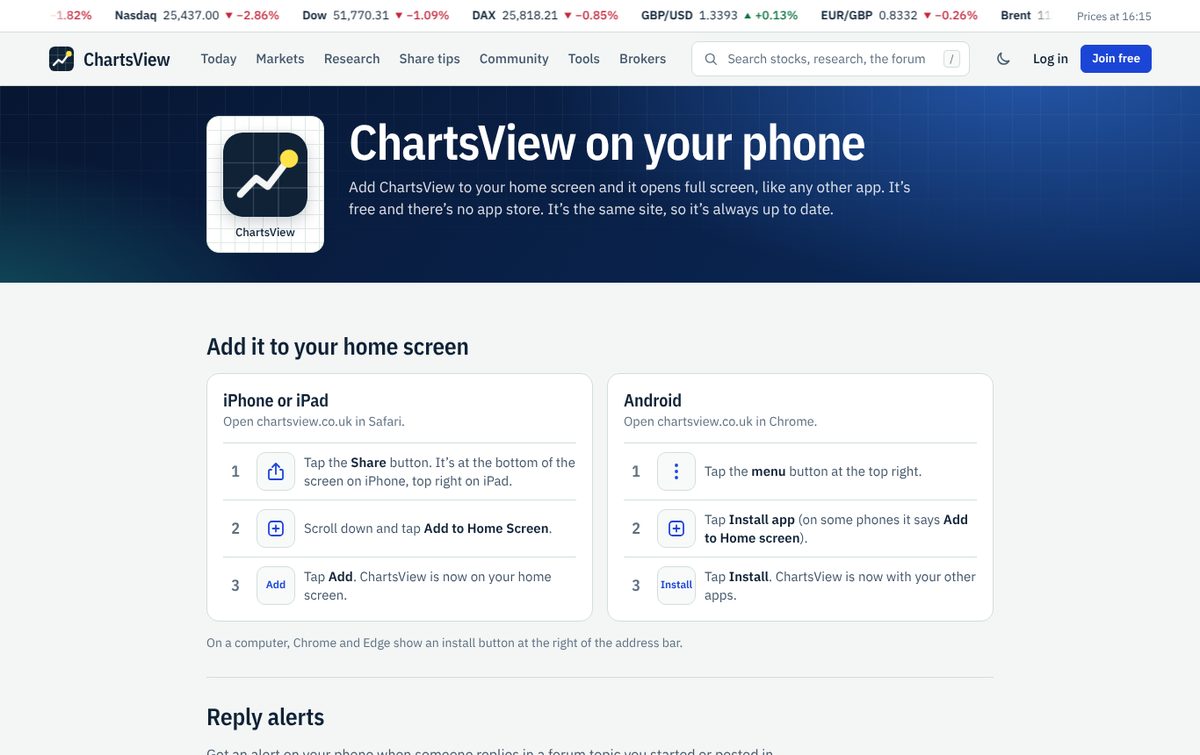
You can now put ChartsView on your phone's home screen. It opens full screen like an app, it is free and there is no app store. Turn on reply alerts and your phone will tell you when someone replies in a forum topic you started or posted in.
Learn to trade, rebuilt
Learn to trade now has 53 in-depth guides with 369 chart examples, covering chart patterns, candlesticks, indicators, risk management and trading psychology. Our classic lessons on chart patterns, candlesticks, RSI, MACD and more have been rewritten in plain English, and every term in the trading glossary (209 of them) links to the guide that explains it in full.
What's next
More company trackers are on the way, and we will keep adding results and new features. Got an idea for something you would like to see on ChartsView? Tell us in the forum, we read every post.
If you are not a member yet, join free. It takes a minute and unlocks paper trading, share tips, the portfolio tracker, the watchlist and the forum.