Cookie Policy

Chartsview Blog

The Latest Blogs from Chartsview

  • Home
    Home This is where you can find all the blog posts throughout the site.
  • Categories
    Categories Displays a list of categories from this blog.
  • Tags
    Tags Displays a list of tags that have been used in the blog.
  • Bloggers
    Bloggers Search for your favorite blogger from this site.
  • Archives
    Archives Contains a list of blog posts that were created previously.
  • Login
gclark25

gclark25

gclark25 has not set their biography yet
3829
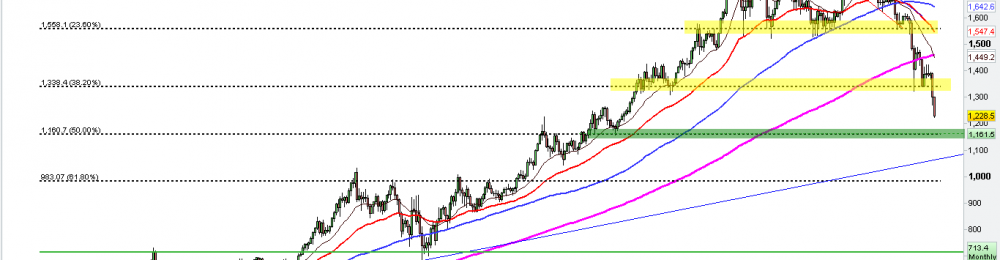
If anyone ever has a doubt about the validity of Fib Extension's - I urge you to take a look at both the Gold Weekly and Daily chart for a start.I decided to take a look at Gold over the last 8 year or so. I took away all the support and resistance level's I had previously and decided to chart Fib extensions running from the low-high from mid 2005 until more recently in Sep 2011 - this is what I saw->   As you can see, there have been two key support area's so far from recent high's. It is absolutely no coincedance that these two levels are consistent with the first 2 Fib retracements. The recent break of the 1300 area would indicate that more low's are to come, with the next area (imo) being the 50% (and the 50% area is commonly referred to as one of the...
Continue reading
Tagged in: Fibonacci Gold Long term
4738
b2ap3_thumbnail_EurUsd_-_RSI_TEST_1H_-_3-4-13_001.png
Evening Guys and Gals,So on this entry I think we will take a closer look at the RSI behaviour in a smaller timescale on the EurUsd and see if we can notice any pattern.The first chart will show peaks in an uptrend - and show examples of where it would be a good spot to have went short - and the subsequent behaviour at these levels.The 2nd chart will do the same - except look at peaks in a down trend. Will be interesting to see if the behaviour is the same.So, without further delay - chart 1, this is just the first random period of 3+ peaks I could find on the 1H chart:   From this chart - we can see 3 of the 4 peaks identified have clear bearish divergence. 2 of the 4 were on the 3rd RSI peak, with the other being less clear.1 thing I...
Continue reading
14238
b2ap3_thumbnail_Eur_Usd_-_weekly_RSI_test.png
Hey guys and gals,I'm writing this blog for 2 main reasons - 1. to test the new, easier to use Blog interface, and 2. to go through some random charts with the aim of looking at the RSI more closely - also to find out the correlation between the RSI and EWT - if indeed there is a strong links In order to do this with no bias other than the assumptions I already have, I am literally going to pick out random charts, aswell as different timelines in order to see if there is any pattern that can be identified.** Note - some or most of you will probably already know or understand any correlation or patterns identified with RSI/Divergence/EWT - but I feel this could be a beneficial exercise for me regardless, and no harm can come of it I imagine. I am also testing out the blogging software as...
Continue reading
3734
Hey guys, Thought I would give this blogging thing a go for the first time! After reading so many good blogs and posts, it cannot help but inspire me to try the same. The worst I will do is learn, the best I can hope for is to give someone a trading idea for the upcoming week or months. Right now as it stands, I look at alot of charts, I annotate most of them, but only post a few on the board. This means that alot get lost in files never to see the light of day again - but if I start posting these charts to get laughed at, I can at least track their progress and determine whether or not my thoughts are along the right track more often than not - or vice versa.  I am hoping the charts speak for themselves - to save you lot...
Continue reading
0
3924
Hey guys,   Thought I would give this blogging thing for the first time!After reading so many good blogs and posts, it cannot help but inspire me to try the same. The worst I will do is learn, the best I can hope for is to give someone a trading idea for the upcoming week or months. Right now as it stands, I look at alot of charts, I annotate most of them, but only post a few on the board. This means that alot get lost in files never to see the light of day again - but if I start posting these charts to get laughed at, I can at least track their progress and determine whether or not my thoughts are along the right track more often than not - or vice versa.  I am hoping the charts speak for themselves - to save you lot having to...
Continue reading
0