RSI - A deeper look - Part 2
in ChartsView Blog:Evening Guys and Gals,
So on this entry I think we will take a closer look at the RSI behaviour in a smaller timescale on the EurUsd and see if we can notice any pattern.
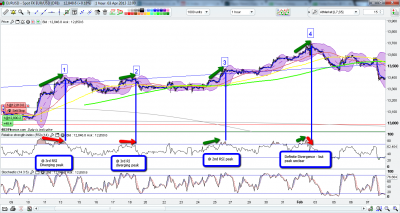
The first chart will show peaks in an uptrend - and show examples of where it would be a good spot to have went short - and the subsequent behaviour at these levels.
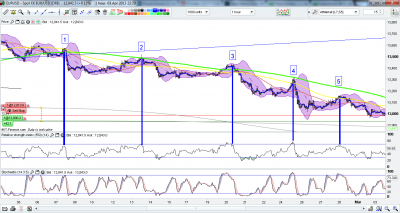
The 2nd chart will do the same - except look at peaks in a down trend. Will be interesting to see if the behaviour is the same.
So, without further delay - chart 1, this is just the first random period of 3+ peaks I could find on the 1H chart:
From this chart - we can see 3 of the 4 peaks identified have clear bearish divergence. 2 of the 4 were on the 3rd RSI peak, with the other being less clear.
1 thing I noticed about the divergences is, it would have been particularly hard to actually pick the correct point to go short, as the RSI peaks did not really chart to a trendline. It seemed slightly more random than I have saw in the past. In this case then, the divergences were really only good to detect a "possible" top, rather than help pick the entry also.
Chart 2 - this chart identifies the peaks on a downtrend. The behaviour here will be interesting to see as this is the dips or peaks where we should really be selling. Often traders prefer to trade with the trend - so these pointsare extremely important tobe able to identify.

So interesting reult here. We can see from the above that in 4 of the 5 peaks, there were no real bearish divergences. In that respect is was very hard to identiy the tops of these moves via the RSI. we would have had to rely on conventional tools such as trendlines or SMA's.
Conclusion - I must admit I am surprised slightly by the results tonight, and it has certainly given me some food for thought in the future. I mean, by conventional methods, you are meant to trade with the trend, that is to sell the downtrend, and buy the up trend - forgetting about the alternate-trend trades on the way.
However, tonight, albeit it on very little data, it would be fair to say that tops are easier to spot using the RSI on an uptrend (when you are not supposed to be selling) and actually harder to identify (when you are meant to sell) on a downtrend. It seems that down moves are so much quicker to develop on a downtrend than they are on an uptrend - and saying that out loud, I guess it makes sense.
It will be really interesting to see how the RSI performs in other charts/timeframes now also.
In the next blog I plan to touch base on EWT - and its possible relation between itself and the RSI.
I aim to choose a good example of an EWT wave set up - and then study the RSI behaviour ( IF ANYONE HAS A SUGGESTION OF SUCH A SET UP, AND THE CHART/PERIOD - LET ME KNOW).
My intentions with these blogs is not to cram everything up all into the one blog - for several reasons:
1. It's easier to read
2. Easier to write
3. Easier to digest and discuss
4. Less boring than it already is!!
By the end, I hope to have gained more knowledge on RSI behavious, how it links with price action, how I can identify future trades, or at least identify potential swings in bias, RSI relation to EWT - and then put it altogether to make me a more accomplished trader.
Thanks for reading if you got this far.
If you have any suggestions or discussion points - PLEASE, feel free to add.


It would be so much better if the charts were either expandable or had links to bigger versions as they are very difficult to read