


Chartsview blog
General trading and all to do with financial markets

ShareTips from 21st October-3rd November
in ChartsView Blog:- Font size: Larger Smaller
- Hits: 20882
- 0 Comments
- Subscribe to this entry
- Bookmark
This blog is an update from the share tips from 21st October to 3rd November 2013 from the Premium Section called Share Tips.There was a possible 390+ points profit to have been made.This obviously assumes the max possible and some of these shares have since closed out and some are still active.
This blog is going to be done like the previous blogs where it will show you the before picture and after pictures of the shares. This is the best way to show this, as its easy to follow and as many know I don't do hindsight trading like many so called pros out there. This blog will show this. I will put the dates on the companies tipped so that members can check when the tips were done so that you know it's the real deal. Like I have said there is no hindsight trading. It's all done by pure charting, here goes.
21st October 2013
ADM.L
Before: This is the Chart of Admiral Group when I first mentioned this:

After: This broke out nicely and has moved over 50 points from the breakout.

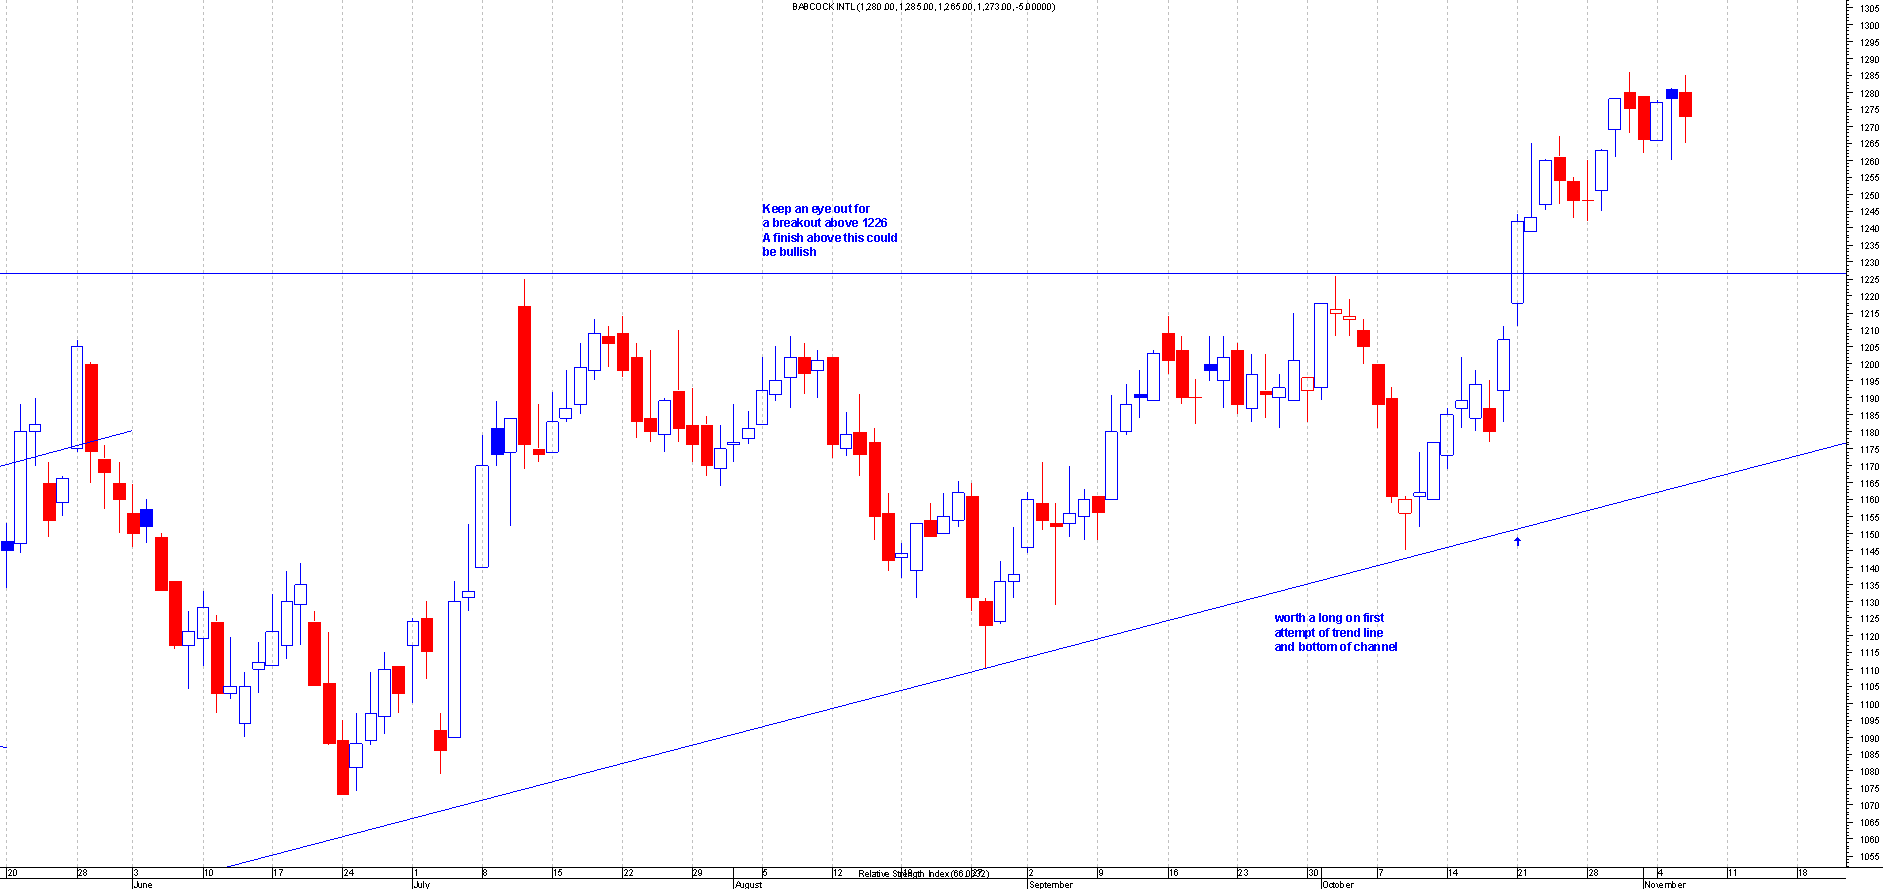
BAB.L
Before: This is the Chart of Babcock International when I first mentioned this:
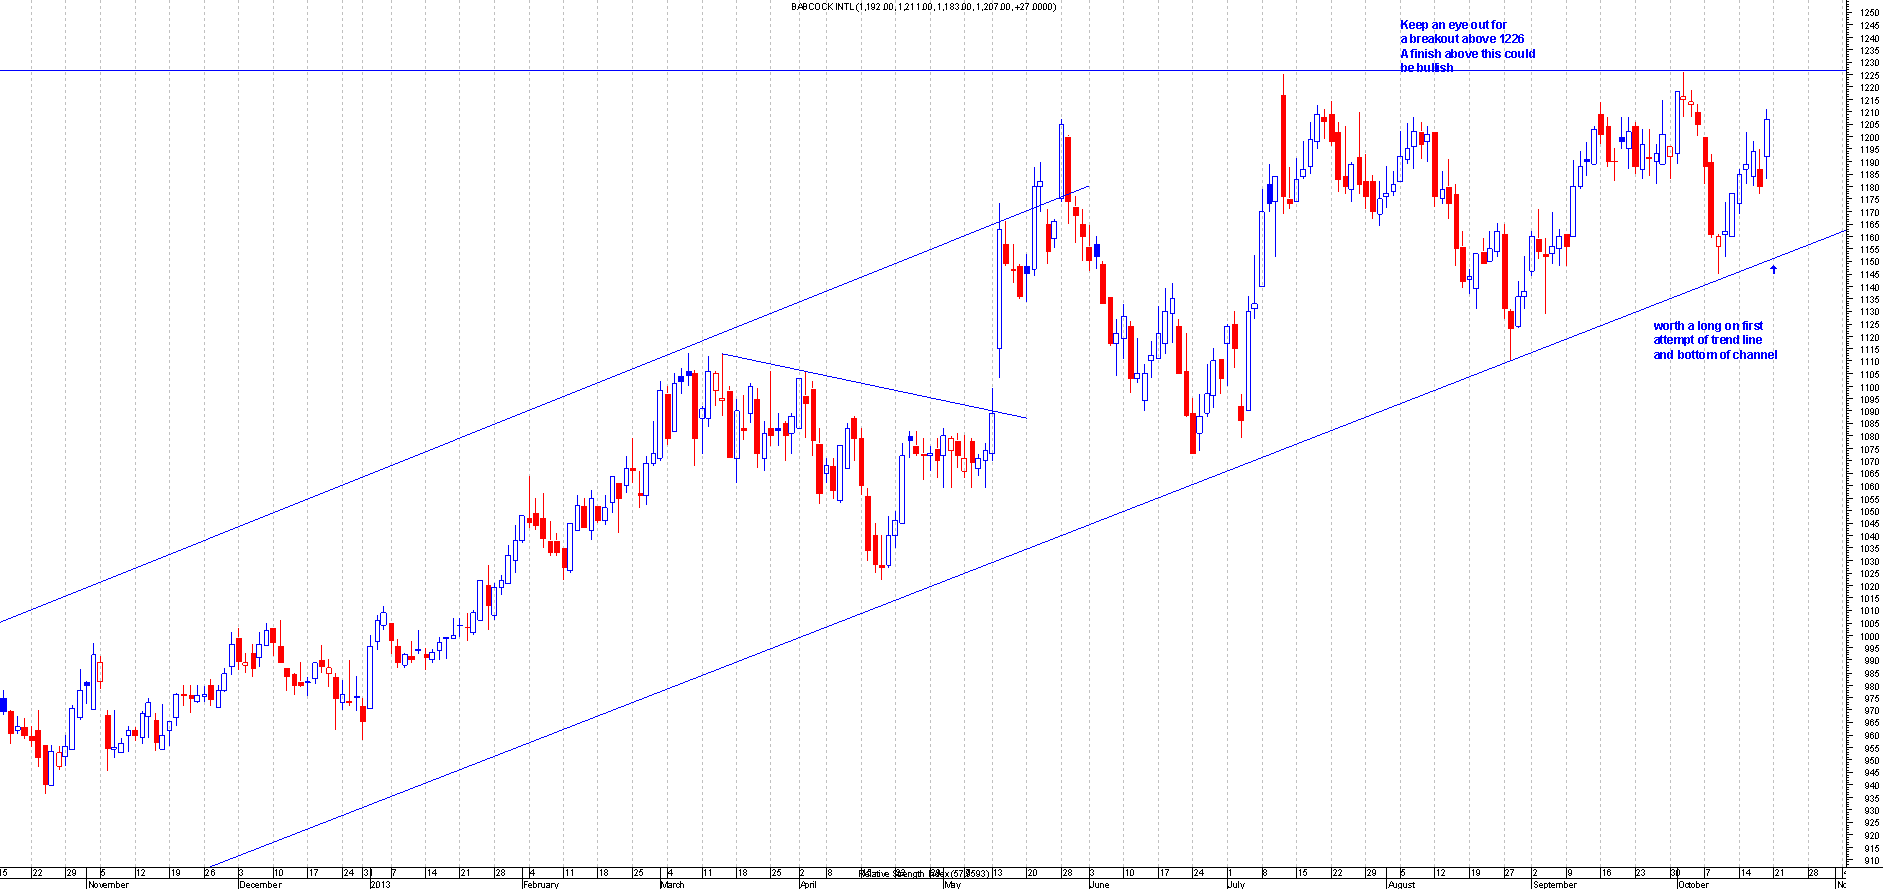
After : This broke out of the Assending Triangle and moved over 60 points.This should be a free trade now.
FRCL.L
Before: This is the Chart of FOR COL Investment TR when I first mentioned this:

After: This broke out of the Symmetrical Triangle but more of a sideways break.This has moved around 7 points in profit so still early in the trade.
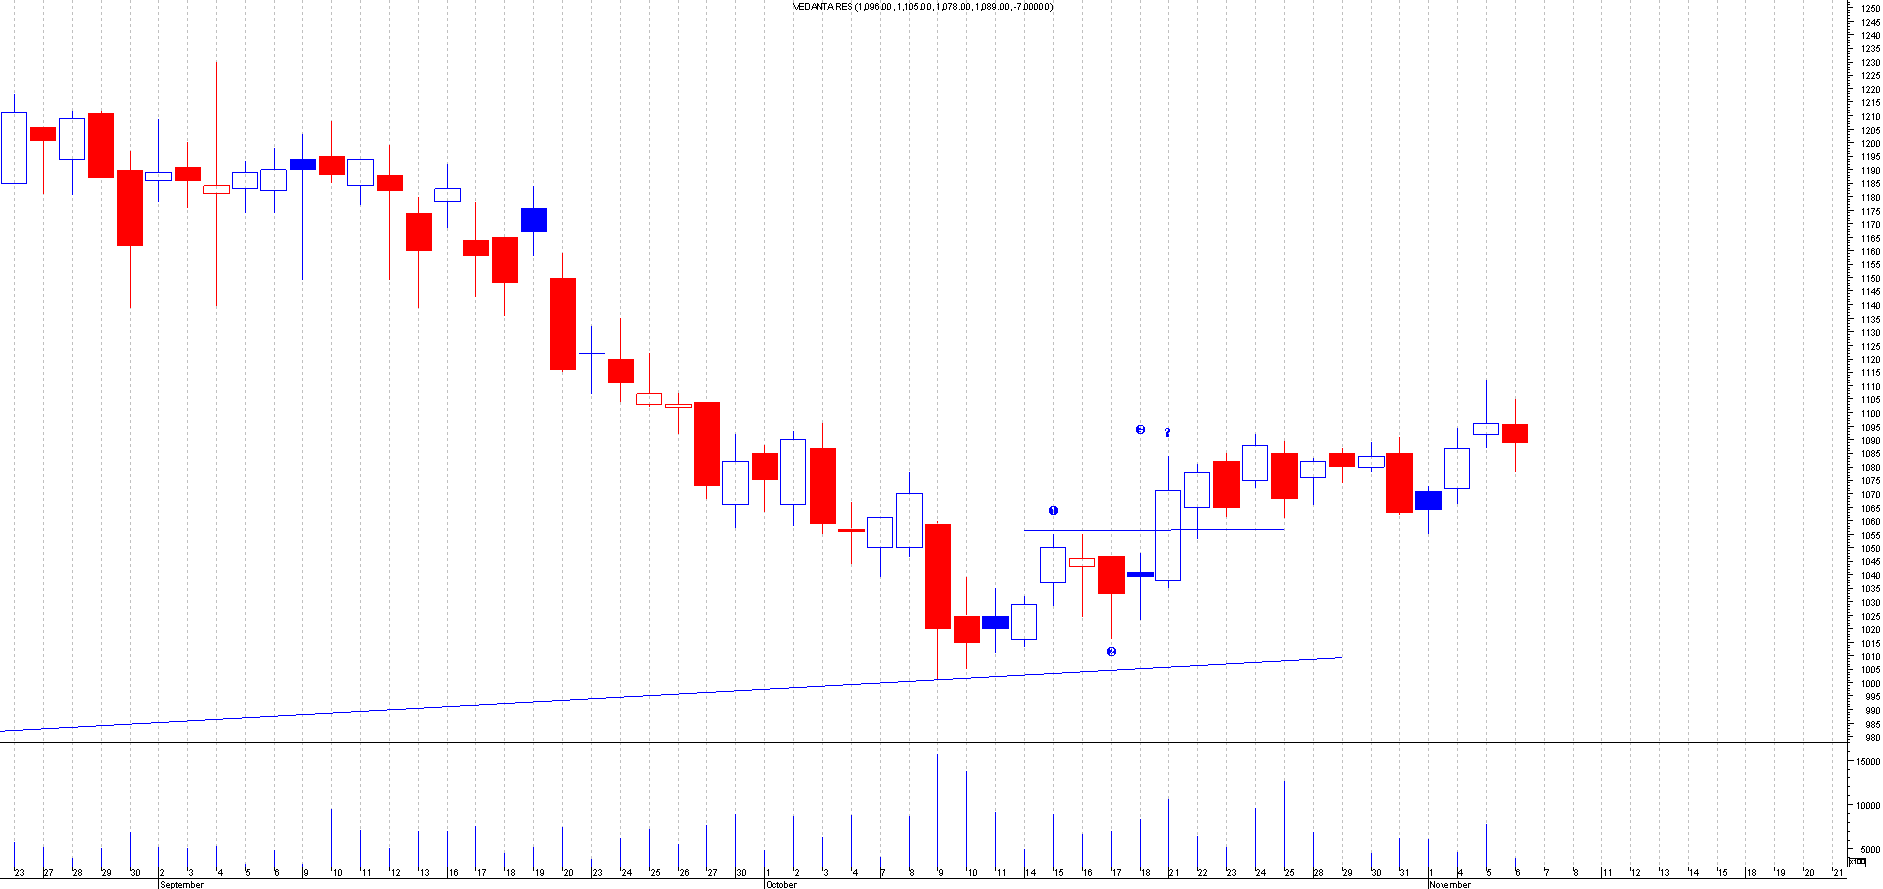
VED.L
Before: This is the Chart of Vedanta Resources when I first mentioned this:
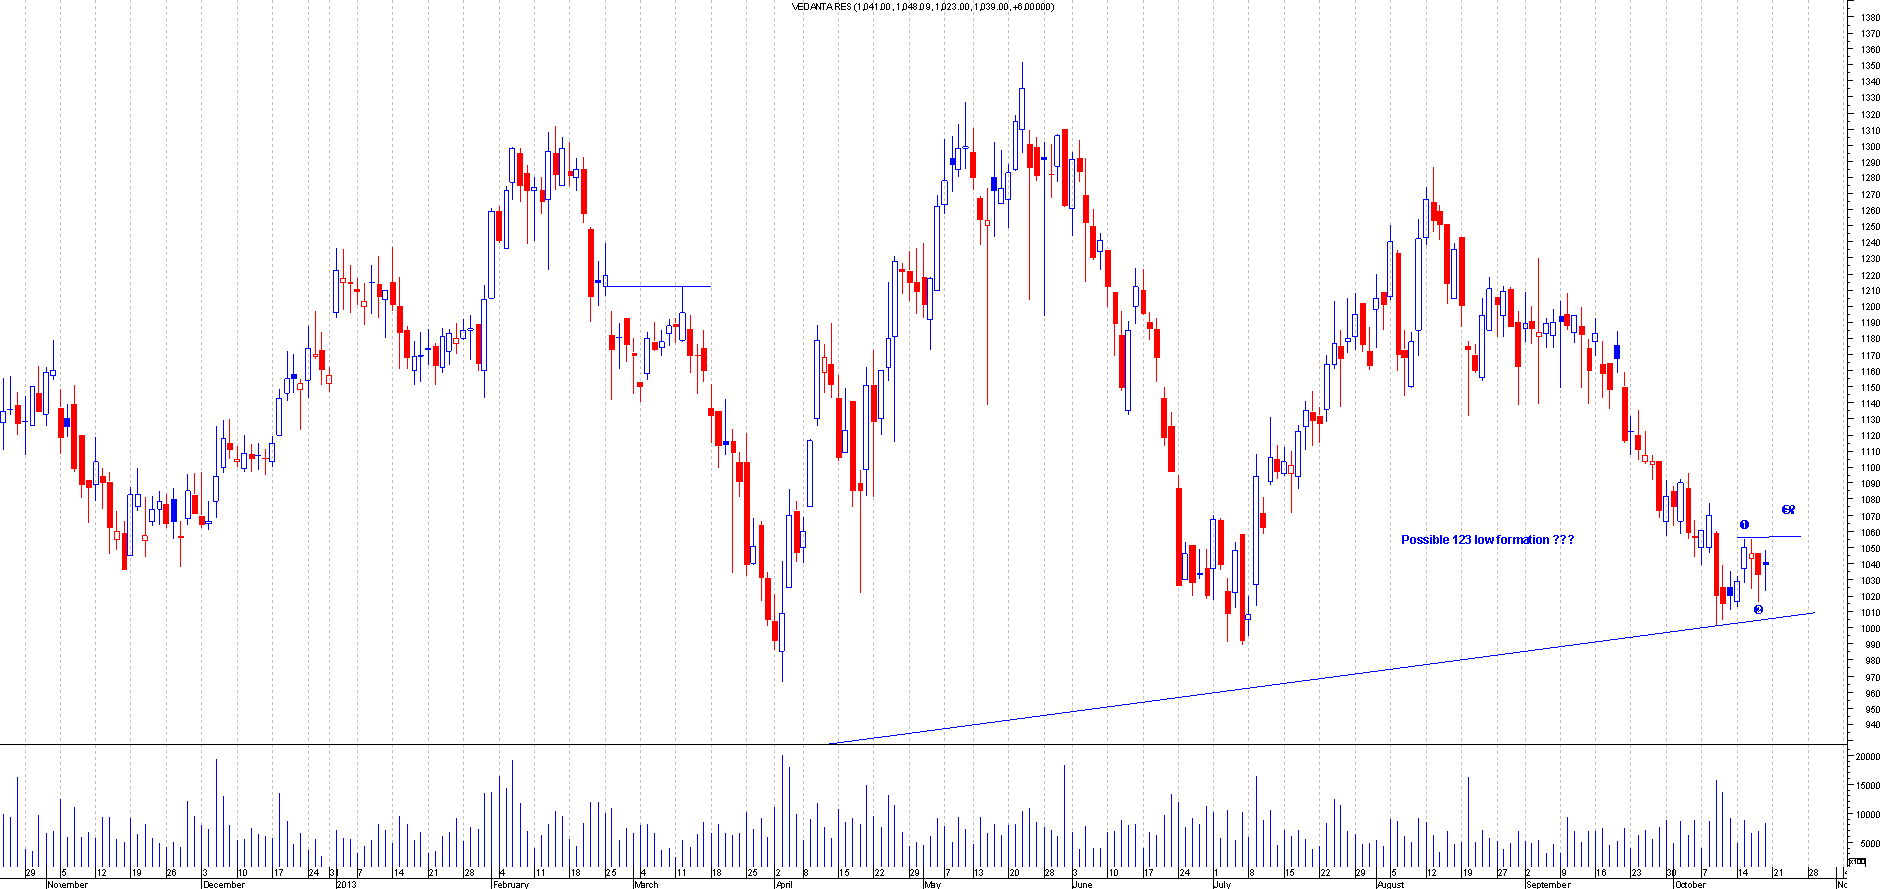
After : This broke out of a 123 low formation and even back tested this.This has moved over 55 points since the tip.
WG.L
Before: This is the Chart of Wood Group when I first mentioned this:
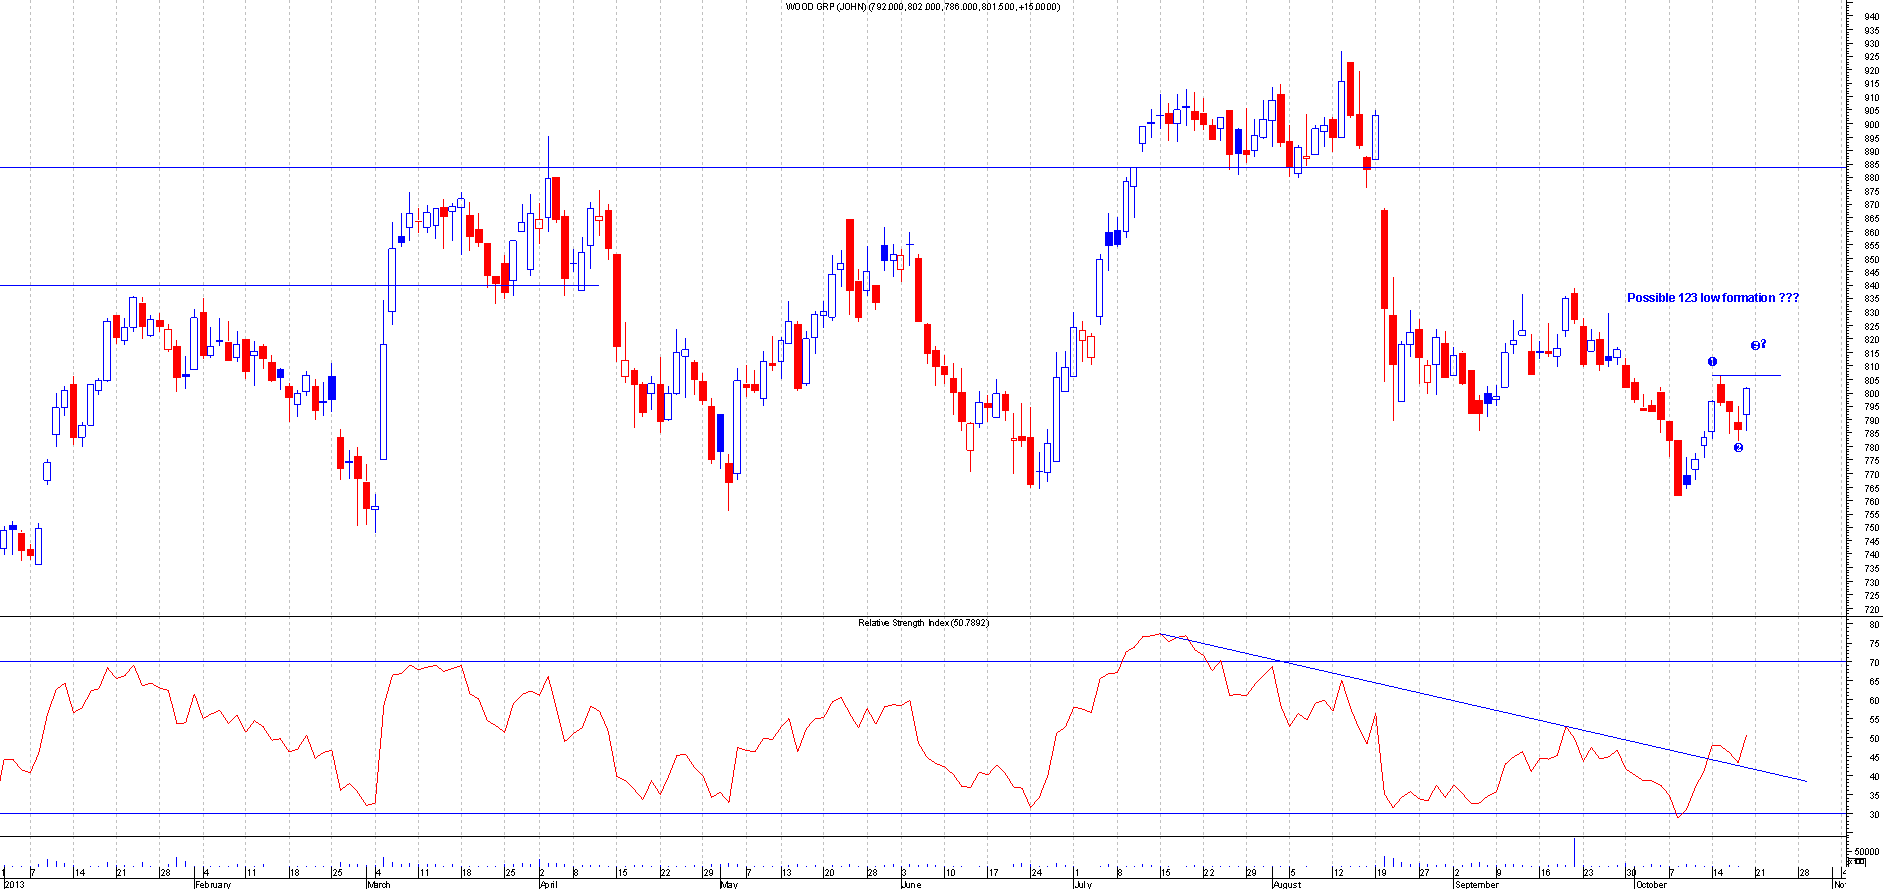
After: This broke out of a 123 low formation and moved about 20 points.This has since gone down so should have made some profit on this .

28th October 2013
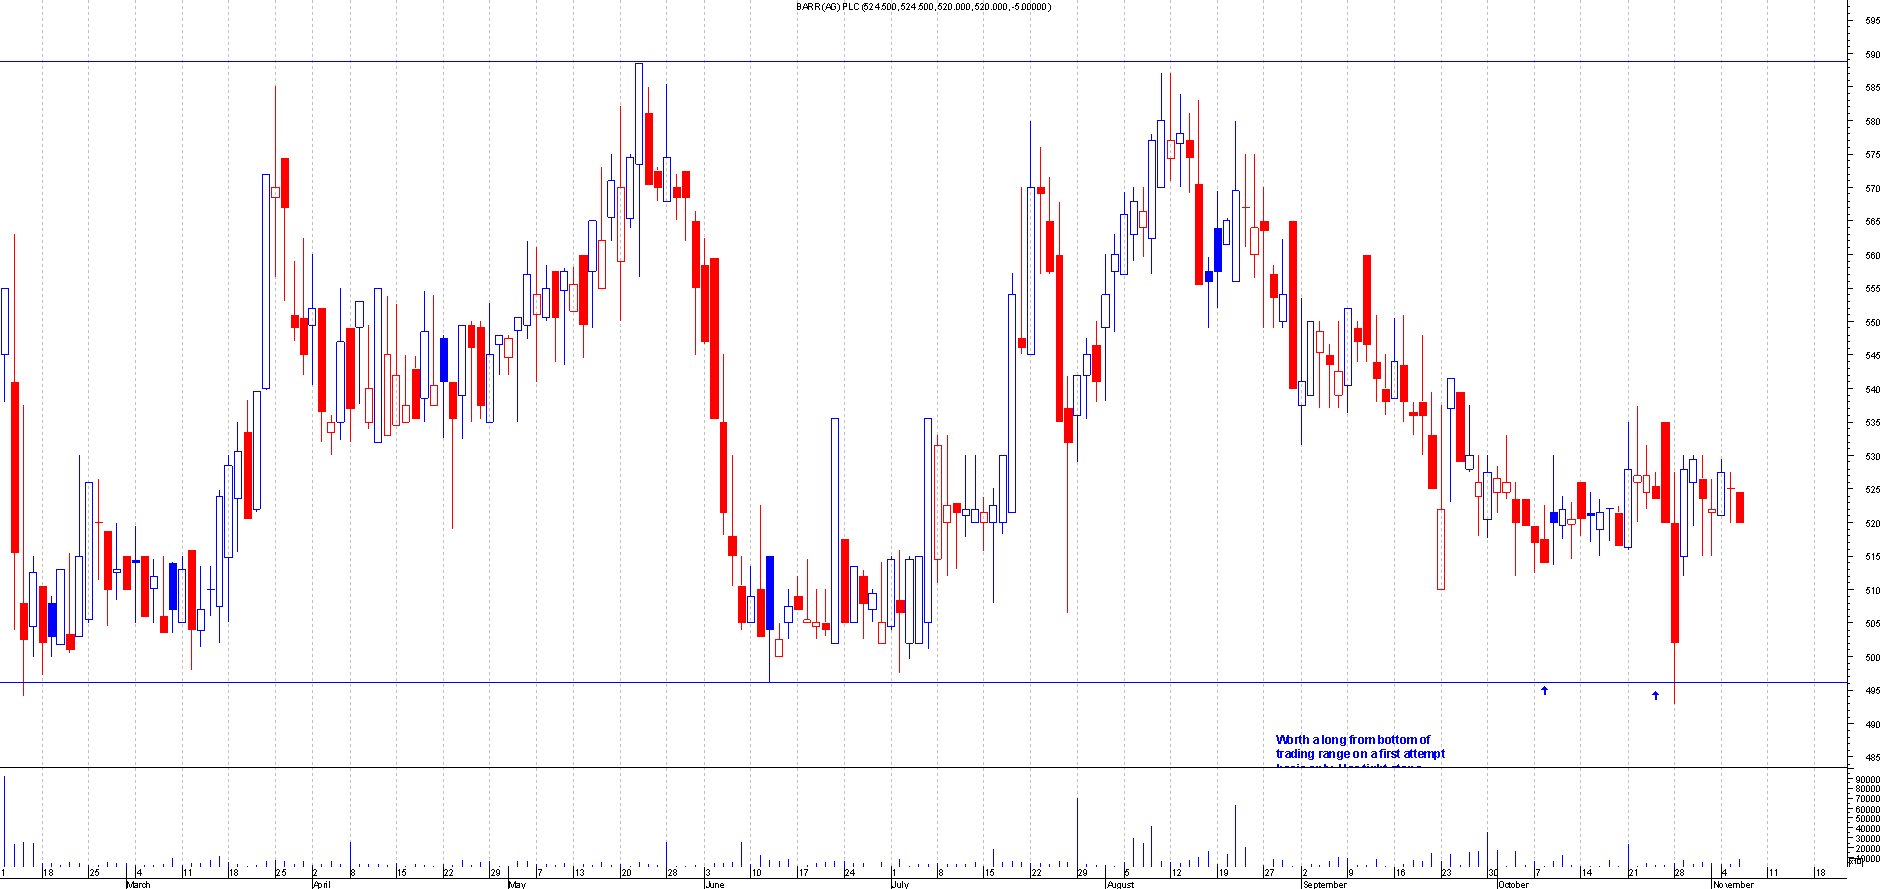
BAG.L
Before: This is the Chart of Barr AG when I first mentioned this:
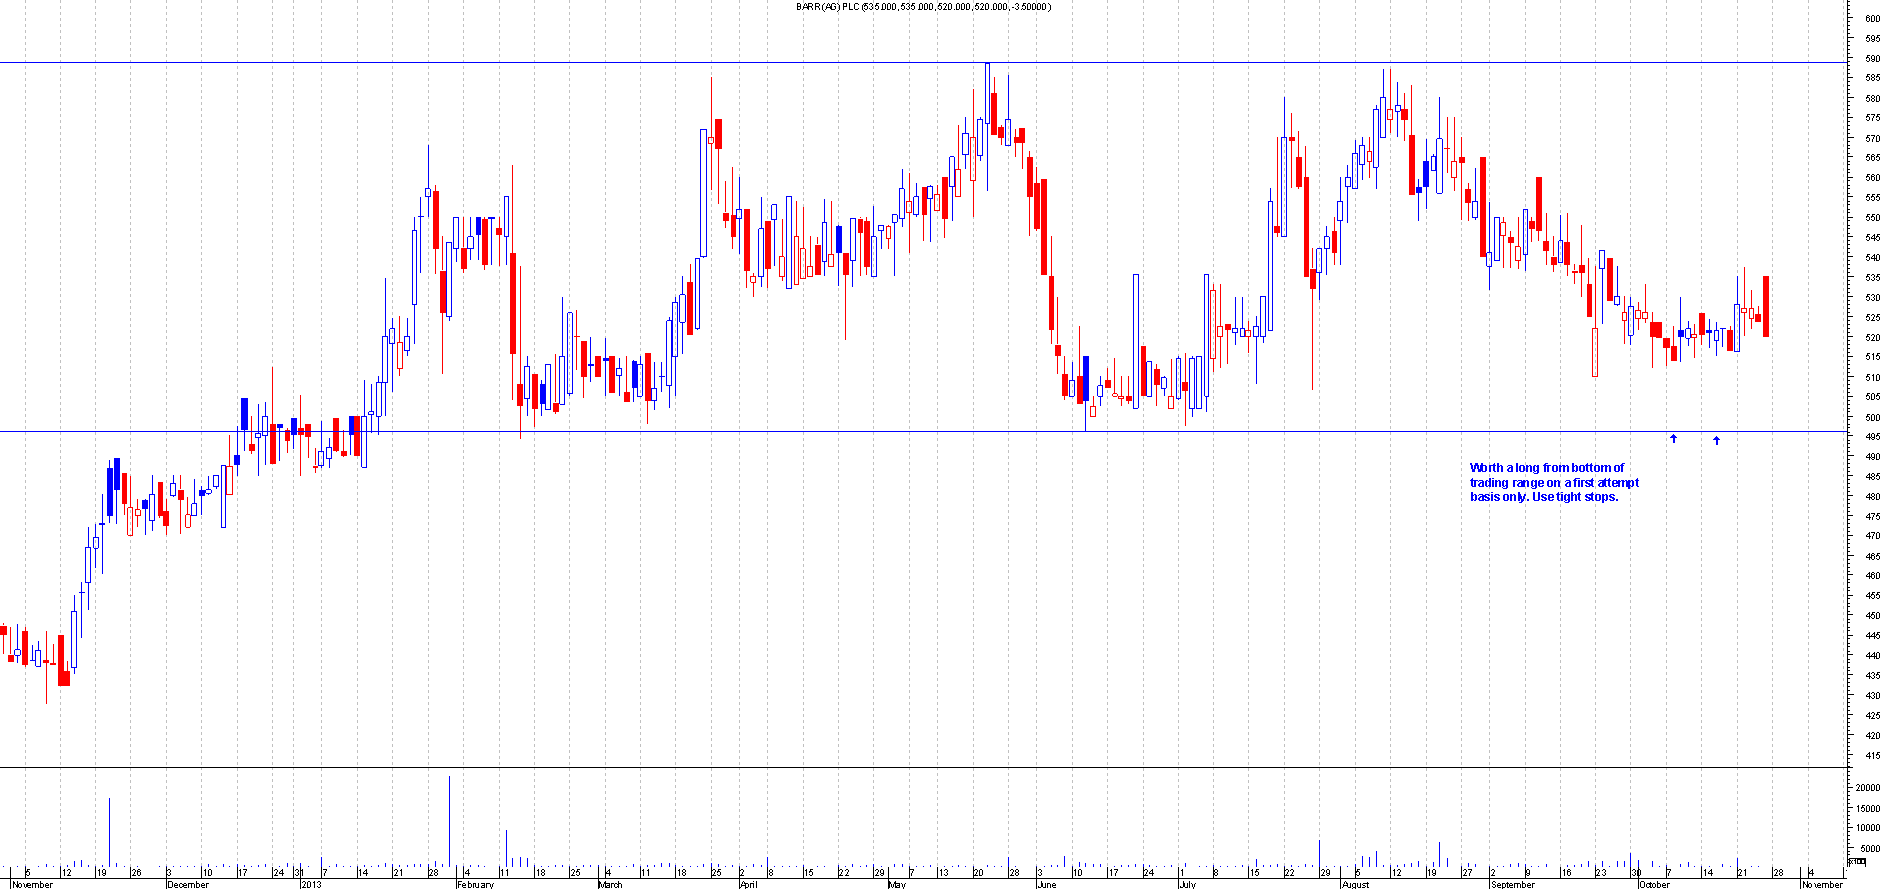
After: This worked out perfectly as this bounced of the strong support as expected. This has since moved over 35 points
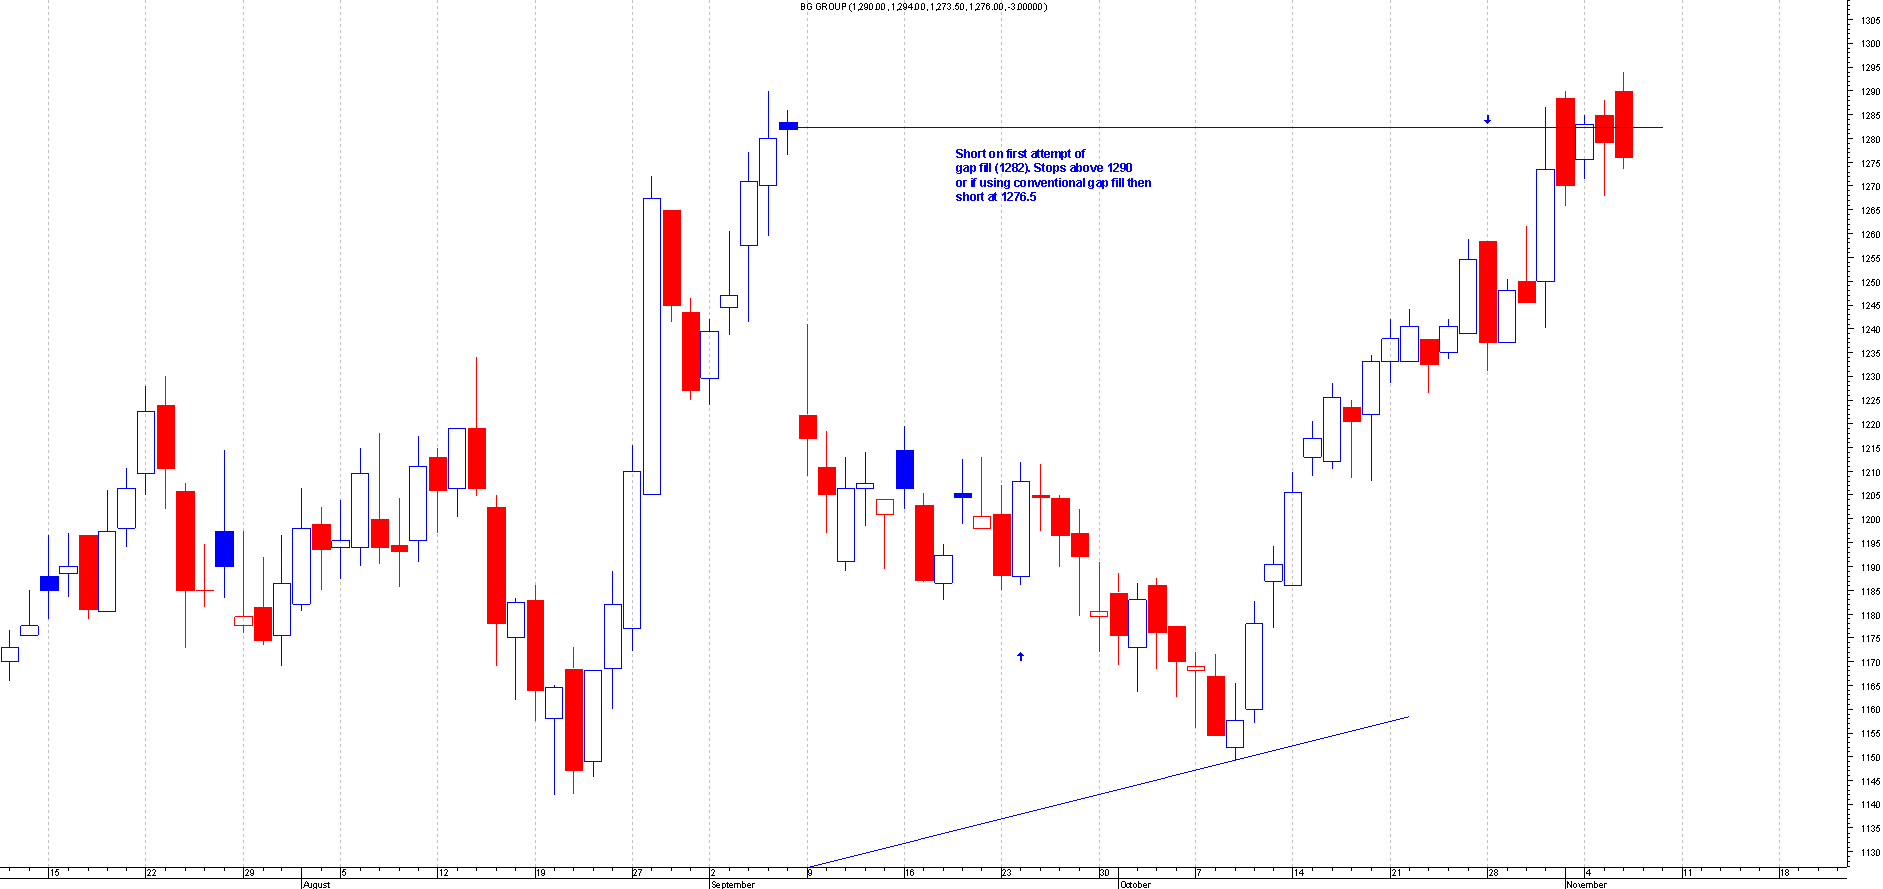
BG.L
Before: This is the Chart of BG Group when I first mentioned this:
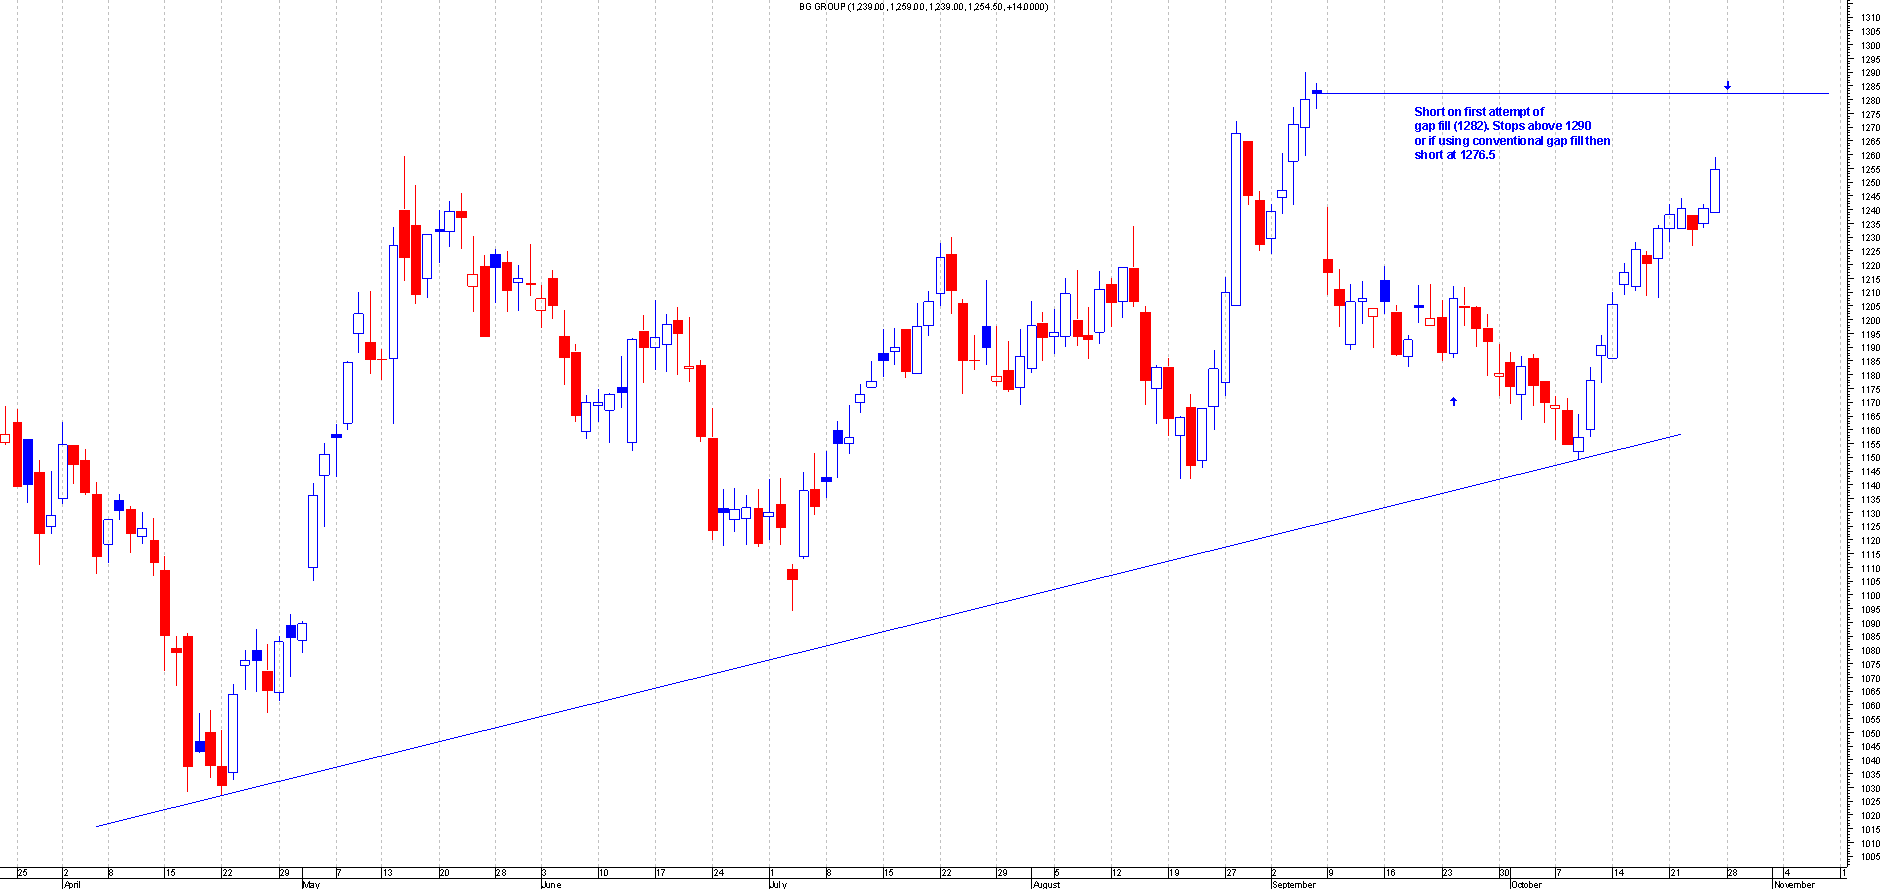
After: This hit the resistance and turned down perfectly for a short term trade. This is still hovering around the resistance but now there is risk attached to this on the short side. This moved about 17 points in profit.
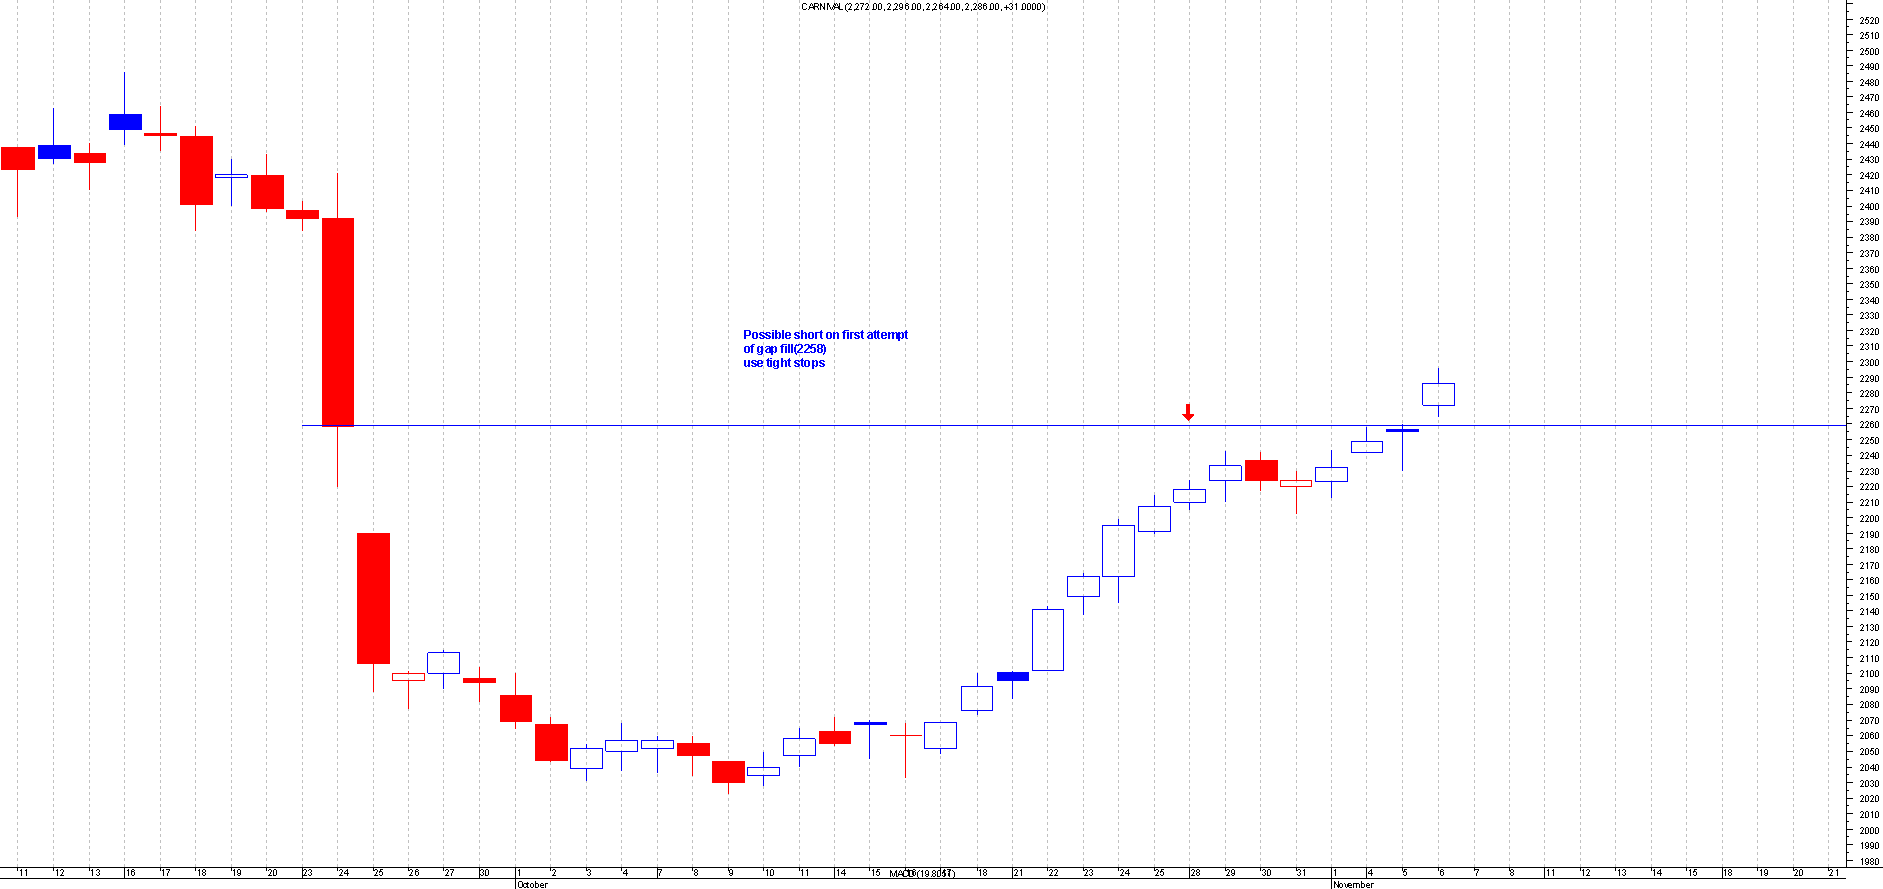
CCL.L
Before: This is the Chart of Carnival when I first mentioned this:
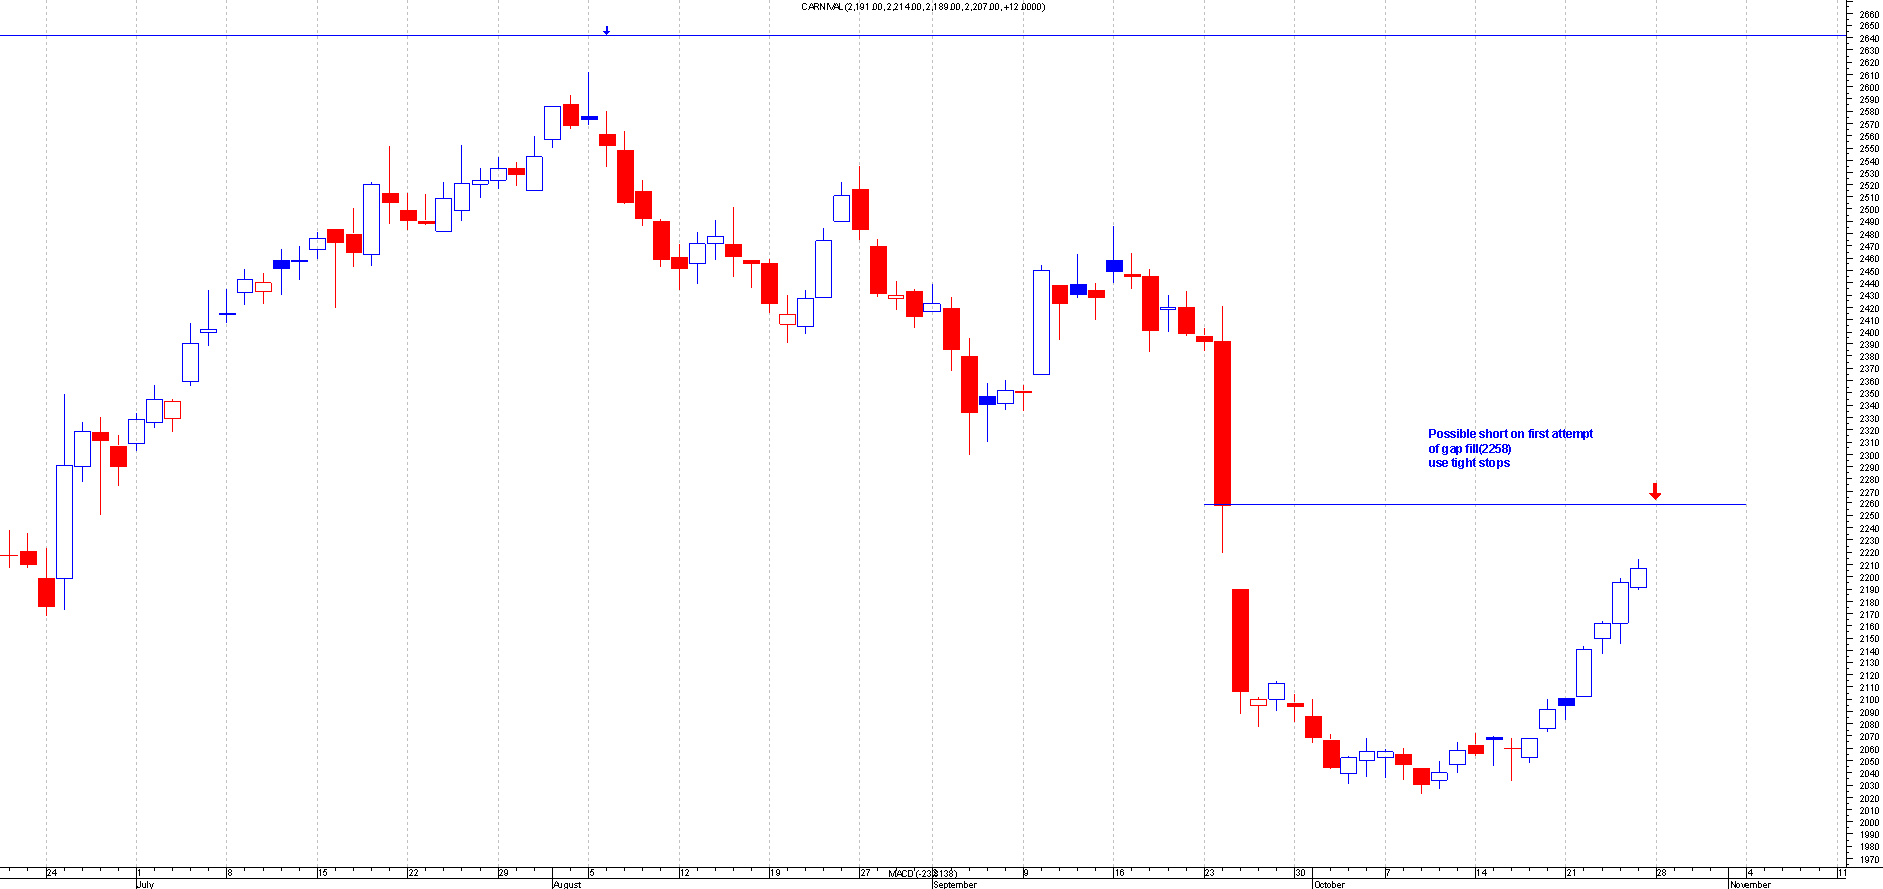
After: This worked out perfectly for a first attempt trade as this moved over 28 points in profit. This has since moved higher so should have made some profit on this trade.
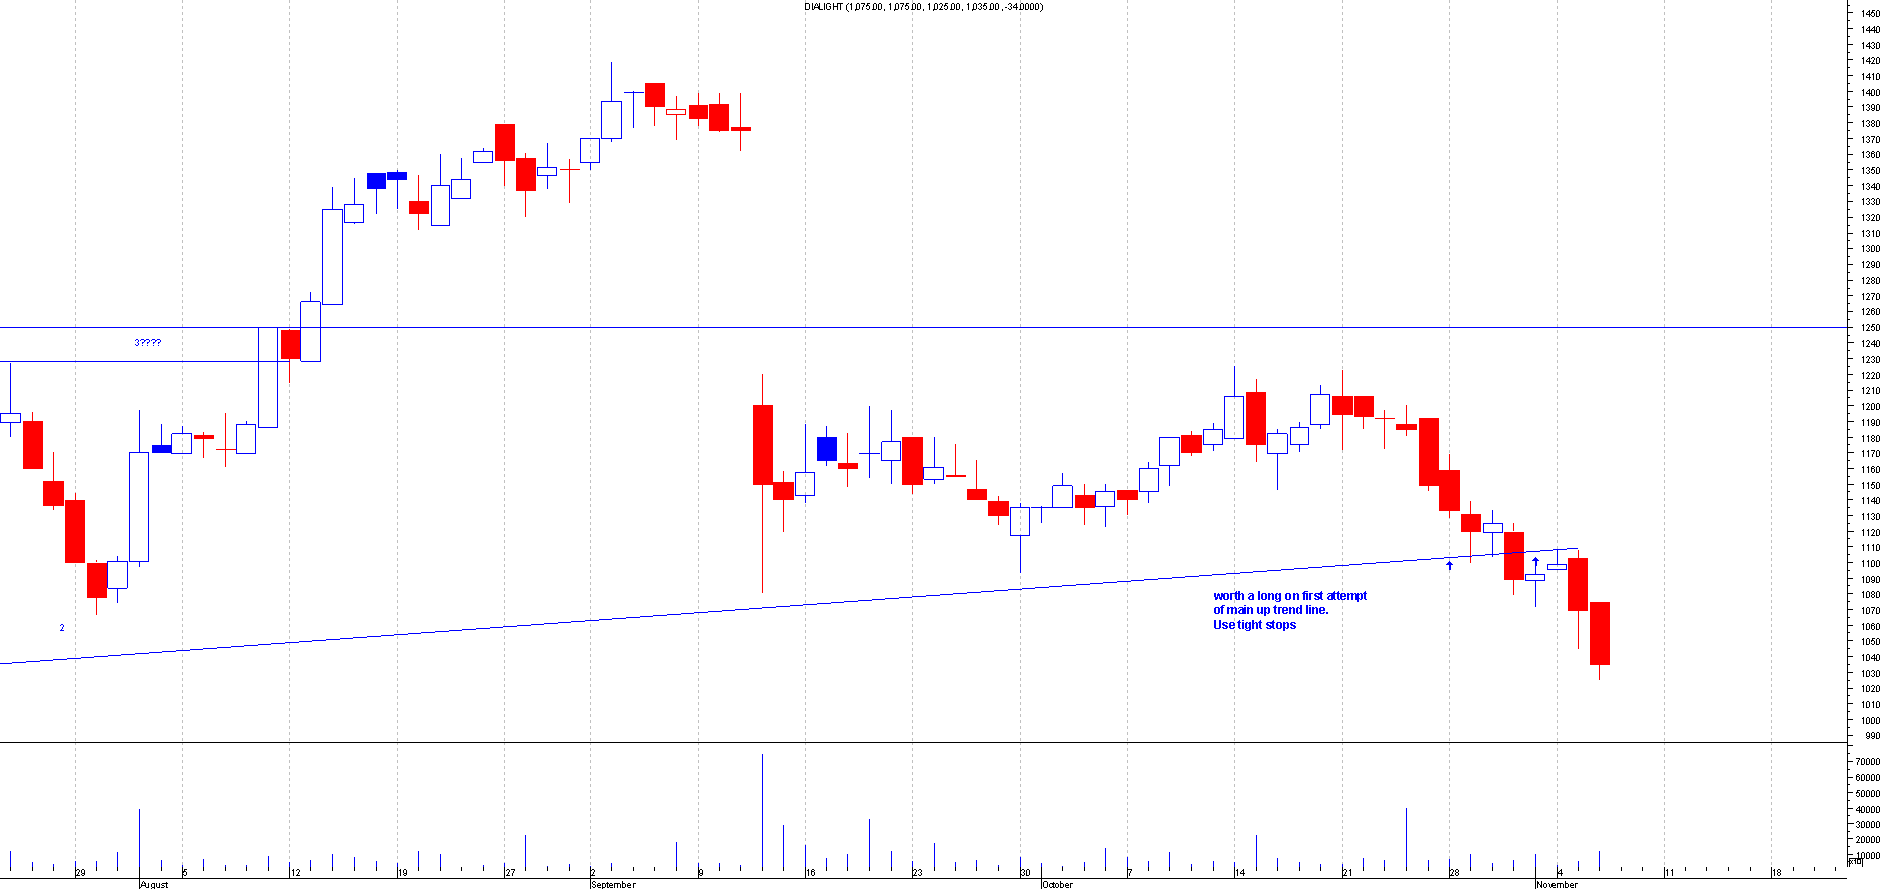
DIAL.L
Before: This is the Chart of Dialight when I first mentioned this:
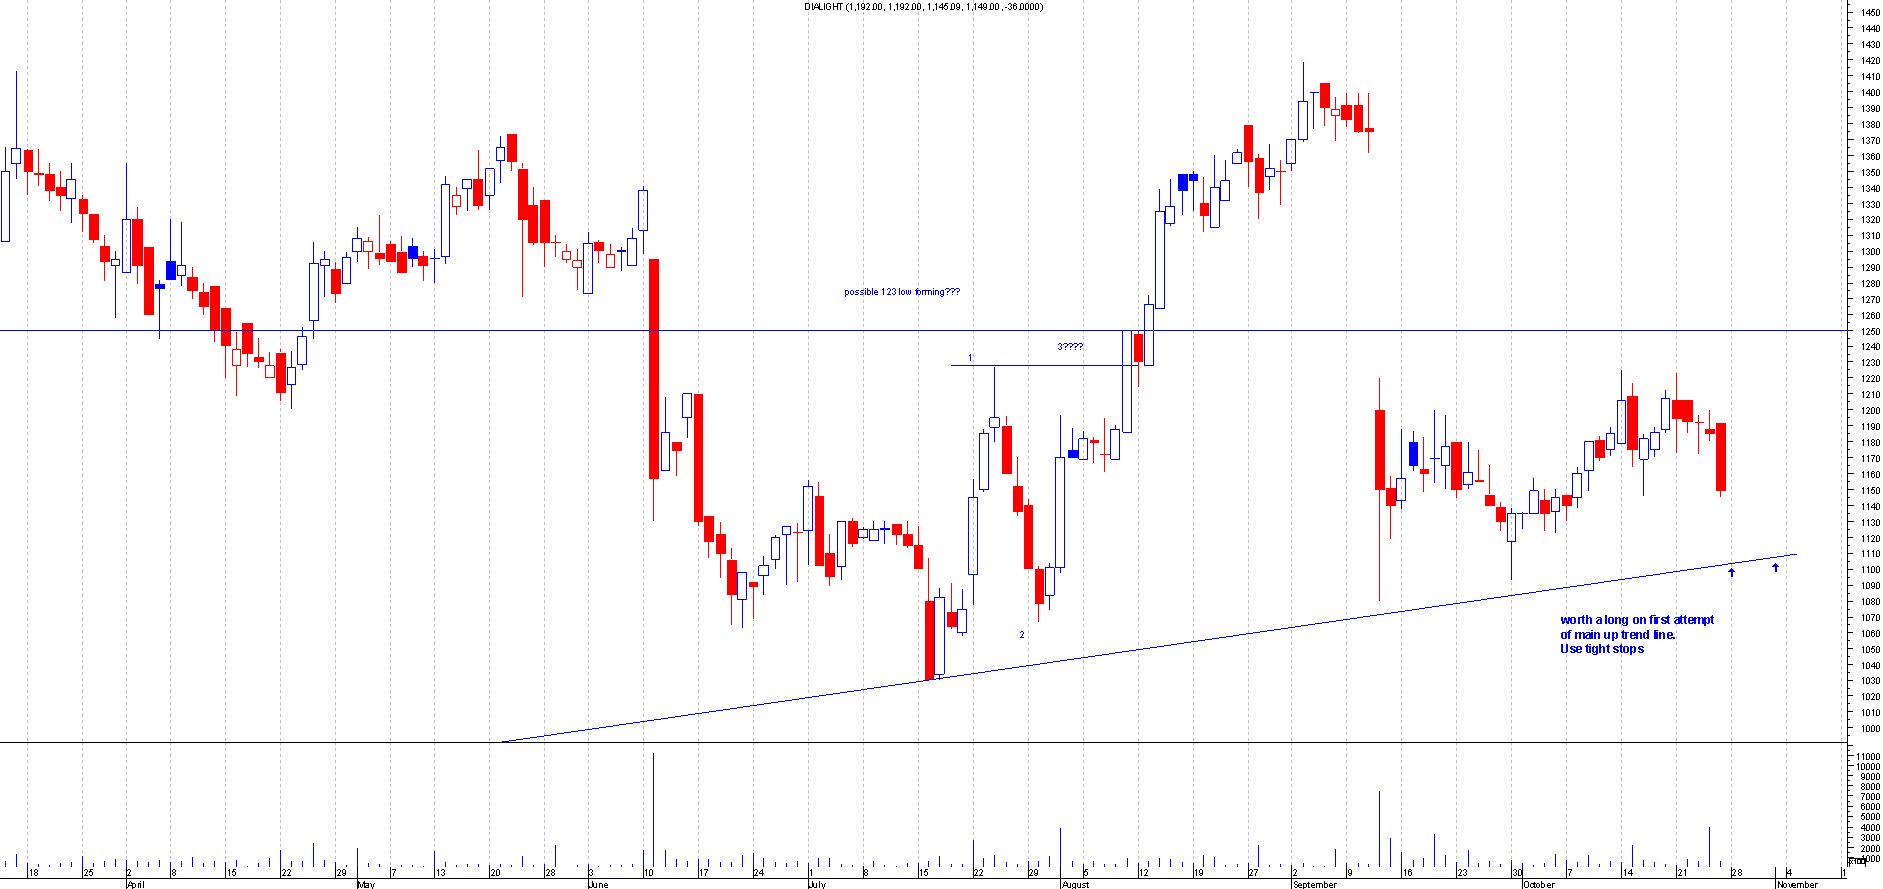
After: This was another one that bounced of perfectly on a first attempt.This shows how good the first attempt trades are.This went over 30 points in profit but has since fallen through the support.
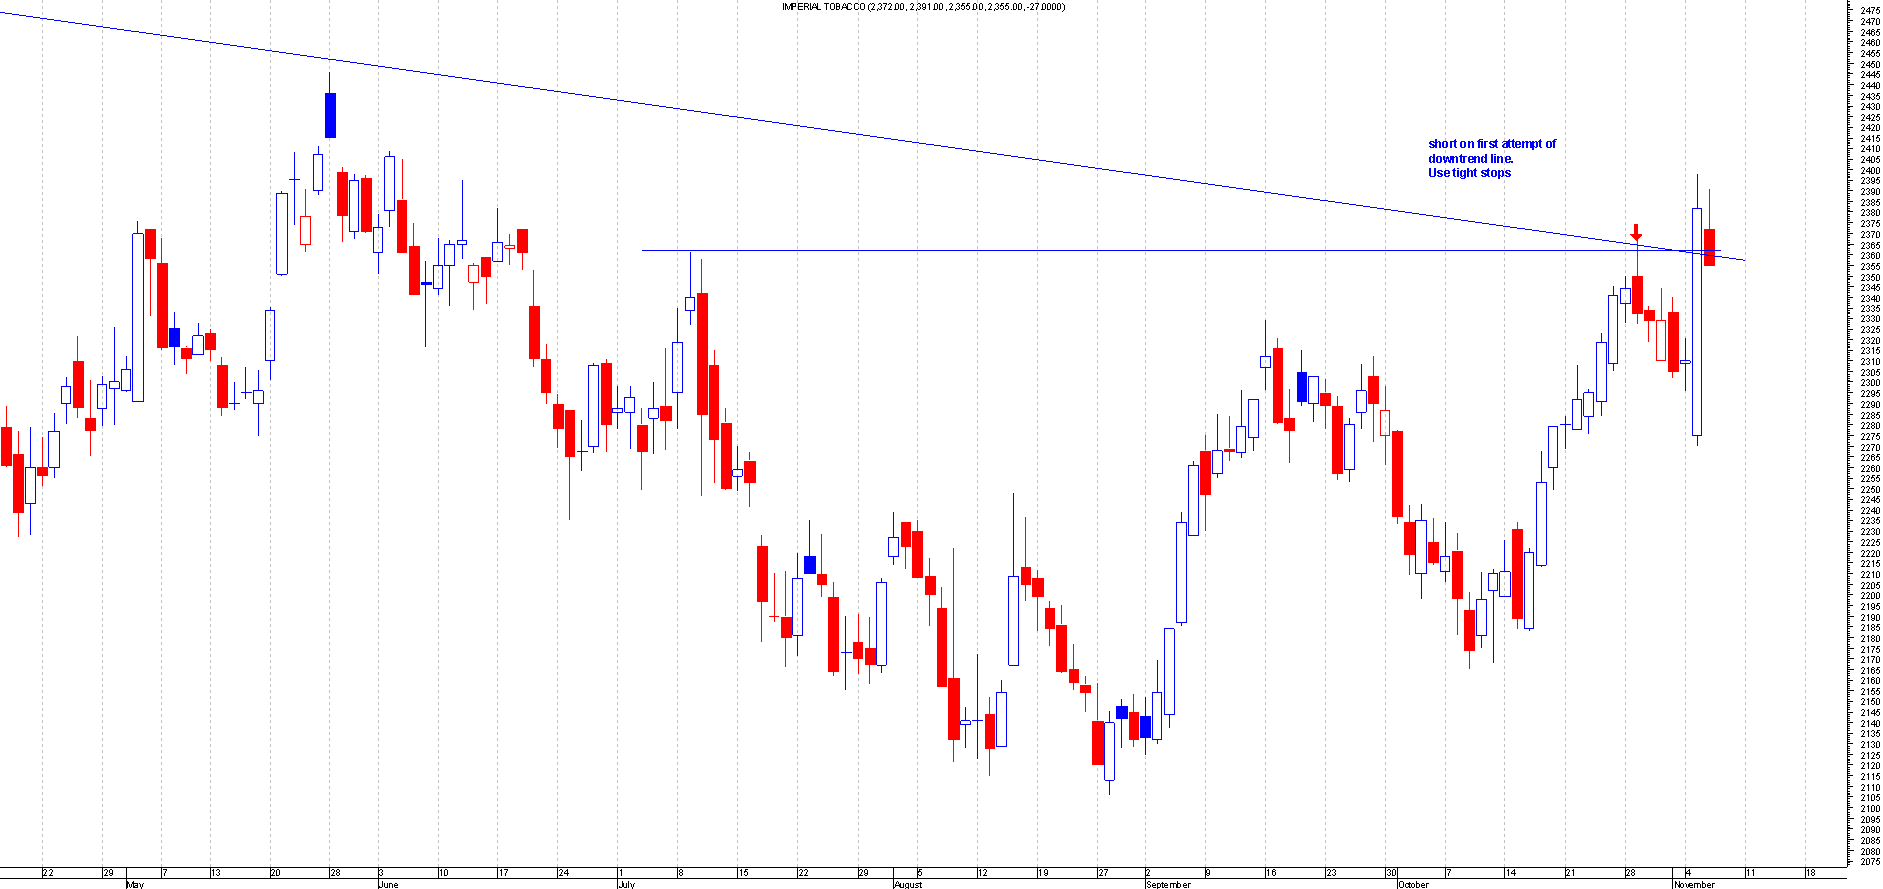
IMT.L
Before: This is the Chart of Imperial Tobacco when I first mentioned this:

After: This is another great first attempt trade. This moved over 90 points from the initial entry. This has since moved higher so shows how good the first attempt trades are.
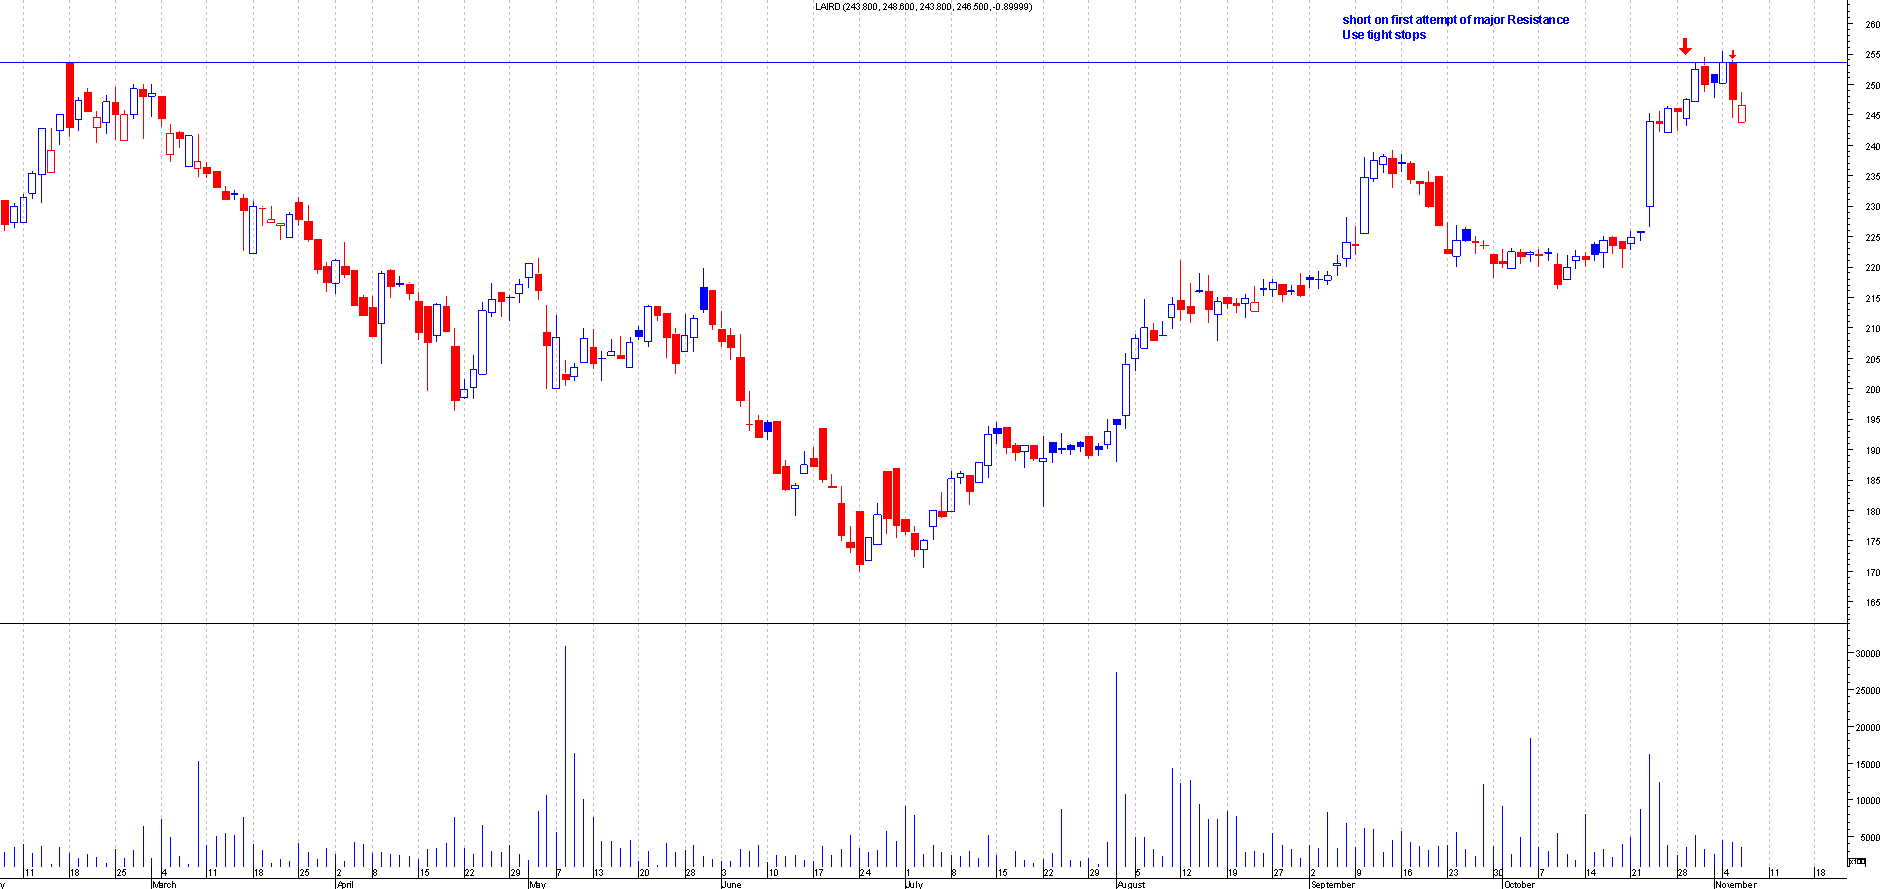
LRD.L
Before: This is the Chart of Laird when I first mentioned this:
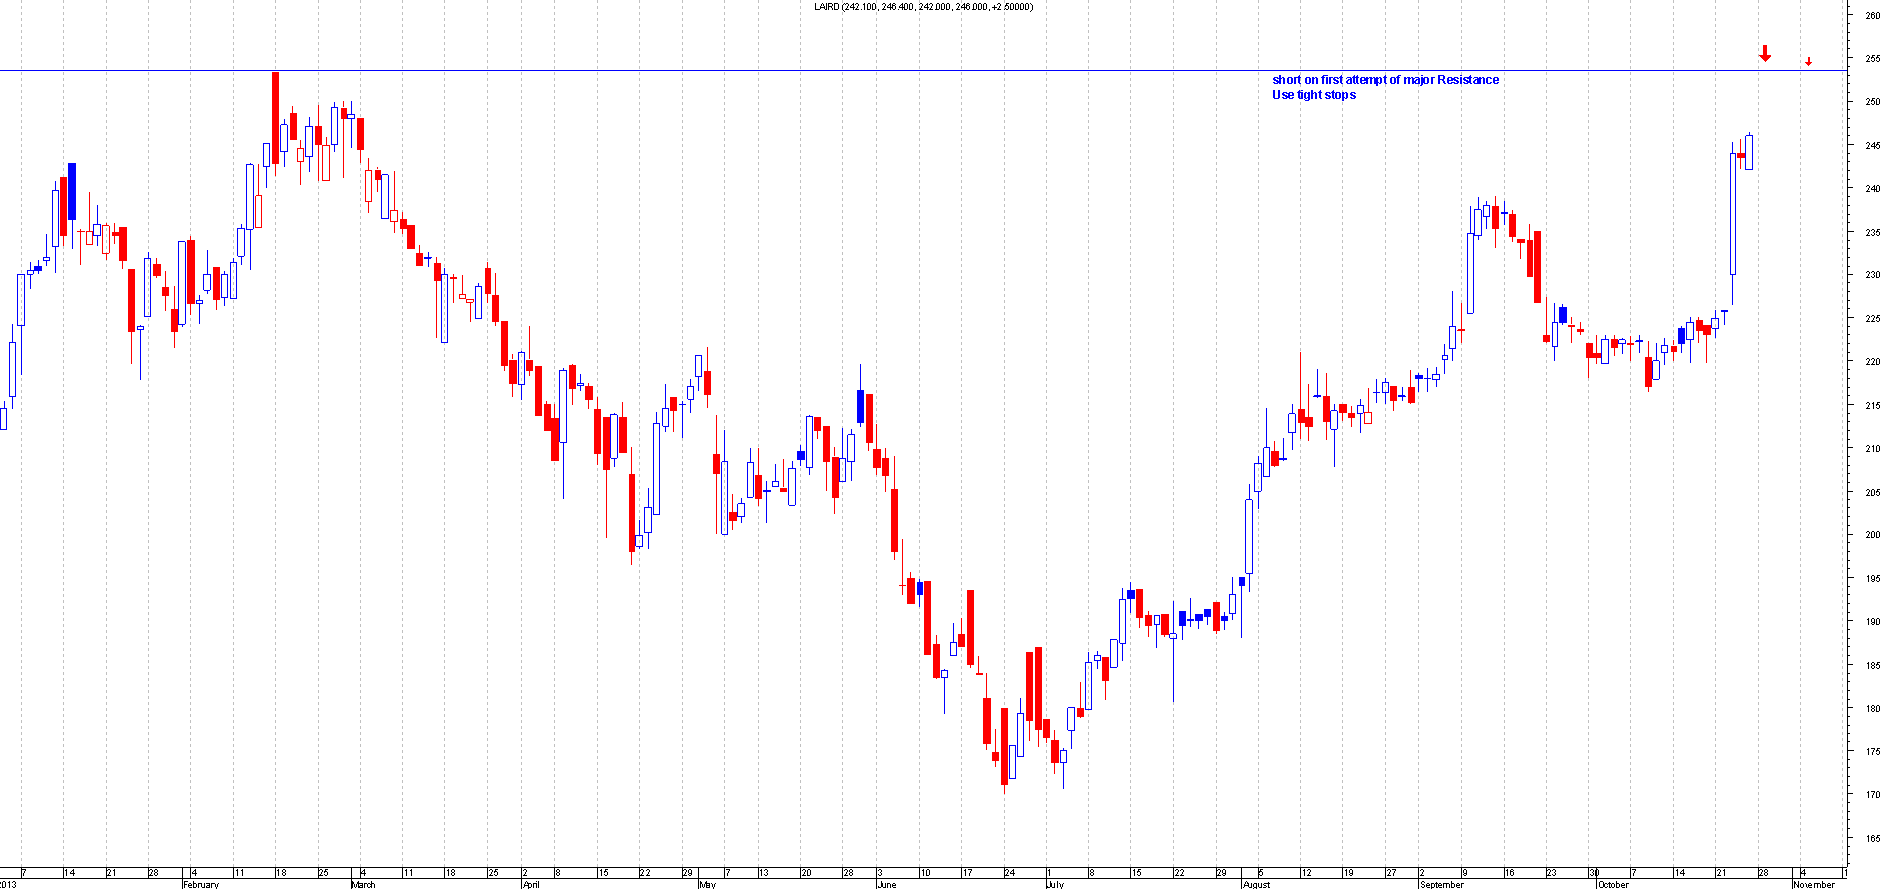
After: This is another good example of a first attempt trade. This moved over 10 points from the short and is still hanging around this area so now there is risk attached to this so profits should be taken and the rest moved to break even.
As can be seen from this blog the share tips section has been performing really well. In 2 weeks it has netted over 390 points. Theres no hindsight trading and the proof is all in the blog as I have shown you the before and after pictures of the tip. If still in doubt then just look through all the share tips in the share tips section.
This blog is done fairly quickly so some of the trades have a lot more to go. This blog should have shown the power of a first attempt trade in action.If you look carefully you should be able to tell how good the resistance and supports are that i give. I pride myself for accuracy and there aint many people that can say the same about there accuracy. It would be nice if others can show real life trades like i do. Chartsview community is about sharing ones knowledge to better our selfs .Most of the tips i give are for the short term trades so please bear that in mind.
All these tips are available through the premuim section of the website and at £39.95 for a years subcription it's a steal. Where else do you get over 500 tips in a year for a measley £39.95?
So what are you waiting for??
Sign up and and join ChartsVew!
ChartsView Membership - Join Now!
remo