


FIB EXTENSIONS - A LOOK AT WHERE GOLD COULD BE GOING
in ChartsView Blog:- Font size: Larger Smaller
- Hits: 6426
- 0 Comments
- Subscribe to this entry
- Bookmark
If anyone ever has a doubt about the validity of Fib Extension's - I urge you to take a look at both the Gold Weekly and Daily chart for a start.
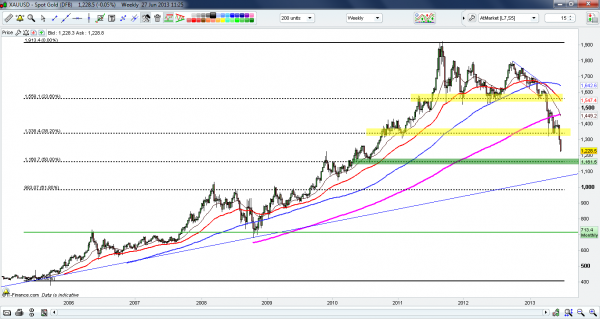
I decided to take a look at Gold over the last 8 year or so. I took away all the support and resistance level's I had previously and decided to chart Fib extensions running from the low-high from mid 2005 until more recently in Sep 2011 - this is what I saw->
As you can see, there have been two key support area's so far from recent high's. It is absolutely no coincedance that these two levels are consistent with the first 2 Fib retracements. The recent break of the 1300 area would indicate that more low's are to come, with the next area (imo) being the 50% (and the 50% area is commonly referred to as one of the most important area's in Fibonacci theory) fib retracement at the ~1150 area. This area is highlighted in green on the chart. We can also see previous S/R level#s in this area from around 2009-2010.
If we take a wee closer look at price action on the daily, we can see these area' further confirmed ->
These level's can be clearly identified and I think anyone studying Fibonacci could utilise the GOLD chart.
Trading idea's.
Well that is up to the individual and the experts. Personally the first thing I have is a buy order at ~1160 with a 50 pip stop targetting 1260 initially, which is a previous resistance area from 2010.
However, more medium term, I see the 50% fib acting as good support, and the catalyst for a corrective wave. This corrective wave could target multiple area's - perhaps the 50% fib from the high to the low move most recent (Oct 12 until present). Perhaps the 100 or 200sma (perhaps both if they meet). Perhaps just a slow, almost ranging move back up to the previous 38.6% fib area of 1300-1350 region. Perhaps it won't correct at all.
Fact is, no one knows. But having certain scenario's mapped out in your head, or on some paper, can only be a benefit for the future planning of your trades.
My bias at the moment points towards a corrective bounce from these area's - but perhaps the EWT guys will have a different viewon things.
But one thing I think we can take from the above charts is the validity of Fib extensions when they work.