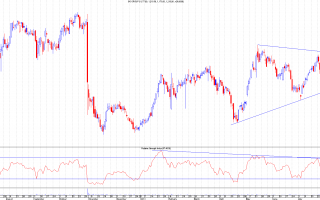
There's no real sign of direction yet here but given the form of the previous move down from 127p it looks to me like this is forming a bear flag indicating further downside.The recent rally halted at the 61.8% Fib of the last drop and the downtrend from the 250p high has not been broken despite the recent bullishness. I can see this moving sideways within the bear flag until it hits the downtrend resistance. We'll then see which direction the SP will likely move in. Original link...
Continue reading
The Wave 2 Option This is the more bullish of the two main options for GKP's wave position.What we have here is the possibility there there have been an initial 5 small waves up to form a larger degree wave 1 at 166p. If this is the case then what we'd expect to see is a retrace down to somewhere like the 50-61.8% Fib level in the form of 3 waves (please note that this "target" area is just the most common for a wave 2 - it could even go as low as 126.3p and still be a wave 2, but they do usually retrace at least 50%).Arguments in favour of this pattern are:1) There appear to be 5 clear waves up from 126.3p to 166p (the bearish option we'll see later would have this as a 3 wave move, not 5);2) The 161p level was breached. A wave 4...
Continue reading
For some unknown reason the comments tab on the last thread "GKP 4-hourly 07/06/13" is not working correctly. I am receiving the comments via my email link and can post replies but I'm aware that these cannot be accessed at the moment.I'm working on finding out what the problem is so I can find a solution. My apologies for the inconvenience.Original link...
Continue reading
I've chosen to use a 4 hour chart here as it fits all the features in nicely. The factors to note are:The trendline from the last few days has broken down. Price gapped up on open to that trendline and dropped straight off it;The RSI trendline from the bullish divergence is providing support and this coincides with the 38.2% Fib. This could signal that this is indeed a correction rather than a final wave down but it's early days yet;The Fib levels to watch are at the 50% and 61.8% levels. These are 146p and 141.5p respectively (note that the 61.8% level also coincides with the low of the drop off 159.5p and was also a key level providing the initial bounce point from the drop off 450p).I would expect that RSI trendline to break as that's what should happen for a wave 2 and it would go in the event...
Continue reading
POG is going along nicely today after a return to the short term trendline. This bodes well for a possible trend change and if it can break through the last high at 142.4p we'll have had consecutive higher lows and higher highs.The next two resistance are shown on the chart but there's also something I missed last time round - look at the doji on the left side of the chart - that had a candle body at the 142.4p level, the same as the previous day's close (give or take 0.1p!). It promptly gapped up from the the following day so these tell us that the market thought that 142.4p was an important level and that's why it acted as resistance a few days ago.I'm kicking myself a bit for having missed that important price action as I could have banked profit there last time but we're nearly back...
Continue reading


