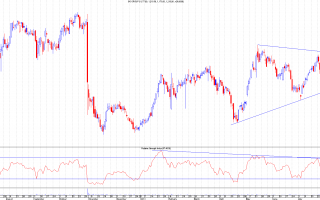
26.5p is still proving to be tough resistance on a closing price basis as SXX hasn't managed to achieve this since 8th May.There could be a symmetrical triangle in play here, or possibly (perhaps more likely) an ascending triangle with a top at 26.5p.Supports and resistances remain as before although the main downtrend resistance has slowly dropped and is now near 28p. Original link...
Continue reading
Having had the hammer off support and a backtest of the previous support area at 69p, we now need the current level to form a higher low if this short rally is to continue.The RSI looks promising but until this has that higher low and then a higher high we can't be sure of anything here. I'm still long with my stop just below 63p but I'd really like to see that 69p level taken out now. Original link...
Continue reading
Not much to add from earlier discussion except to point out the big drop in volume and narrowing range of daily price movement. These both suggest a move is coming (the Bollinger Bands are also fairly narrow which suggests the same).While 147/8p has been a subborn support, the main target areas (should it drop) are all around the same general support area. There's the short term uptrend formed by the 126.3p low and the higher low which followed, the original breakout point of 137.5p, the 61.8% Fib at 141p and the 78.6% Fib at 134.75p. That's 4 support areas all pretty close together. Should they fail, the uptrend support which caused the bounce from 126p is now at 127.25p as next support.On the upside, the main number to break now is that (re-drawn) down channel resistance at 160p then the 166p recent high. Original link...
Continue reading
Well, this is how it goes in trading sometimes - you watch and wait for a target and get caught out and miss the move. No problem, that's the game but well done to everyone who gained on this in the last 2 days.My target was the 38-42p area - the 61.8% Fib - based on there having been an apparent 5 waves up plus further support at that level. I have no idea whether there's been any news or not but I won't be entering this now.It'll be interesting to see how this plays out now as today's action closed back bang on the downtrend resistance (it's not got enough price history for any level to be really important) having broken out but this whole pattern looks worrying to me. I think it needs to make significant new highs to avoid a very bearish formation here but I've already...
Continue reading
I had the Dow Jones in a wave 4 pattern and posted that it may have ended at the 14844 low. I've changed my mind on this and now think we're in wave B of 4. I'll be looking to go short at 15409 if it gets there today. If not the target price will drop for tomorrow's cash chart. I'll have stops in place of course.Wave 4s do usually cause this confusion as they're the main battle area between bulls and bears hence the violent moves and uncertainty.Remember, index trades carry a great deal of risk unless managed very carefully. Leverage is high and the Dow can move 100s of points in less than an hour someti Original link...
Continue reading


