Chartsview blog
General trading and all to do with financial markets
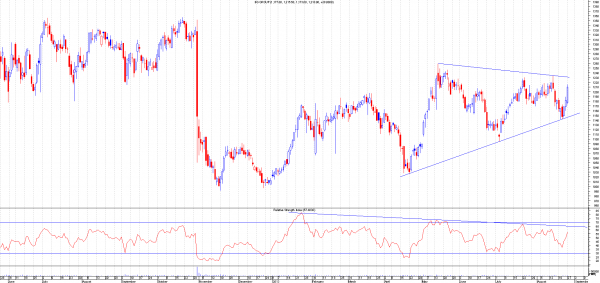
This blog is an update from the share tips from 4th November to 1st December 2013 from the Premium Section called Share Tips.There was a possible 2000+ points profit to have been made.This obviously assumes the max possible and some of these shares have since closed out and most are still active. November was a good month in terms of profits made but please bear in mind some tips did fail but the losses were small compared to the gains from the wining shares.
This blog is going to be done like the previous blogs where it will show you the before picture and after pictures of the shares. This is the best way to show this, as its easy to follow. I will put the dates on the companies tipped so that members can check when the tips were done so that you know it's the real deal.
here goes
4th November - 10th November 2013
BARC.L
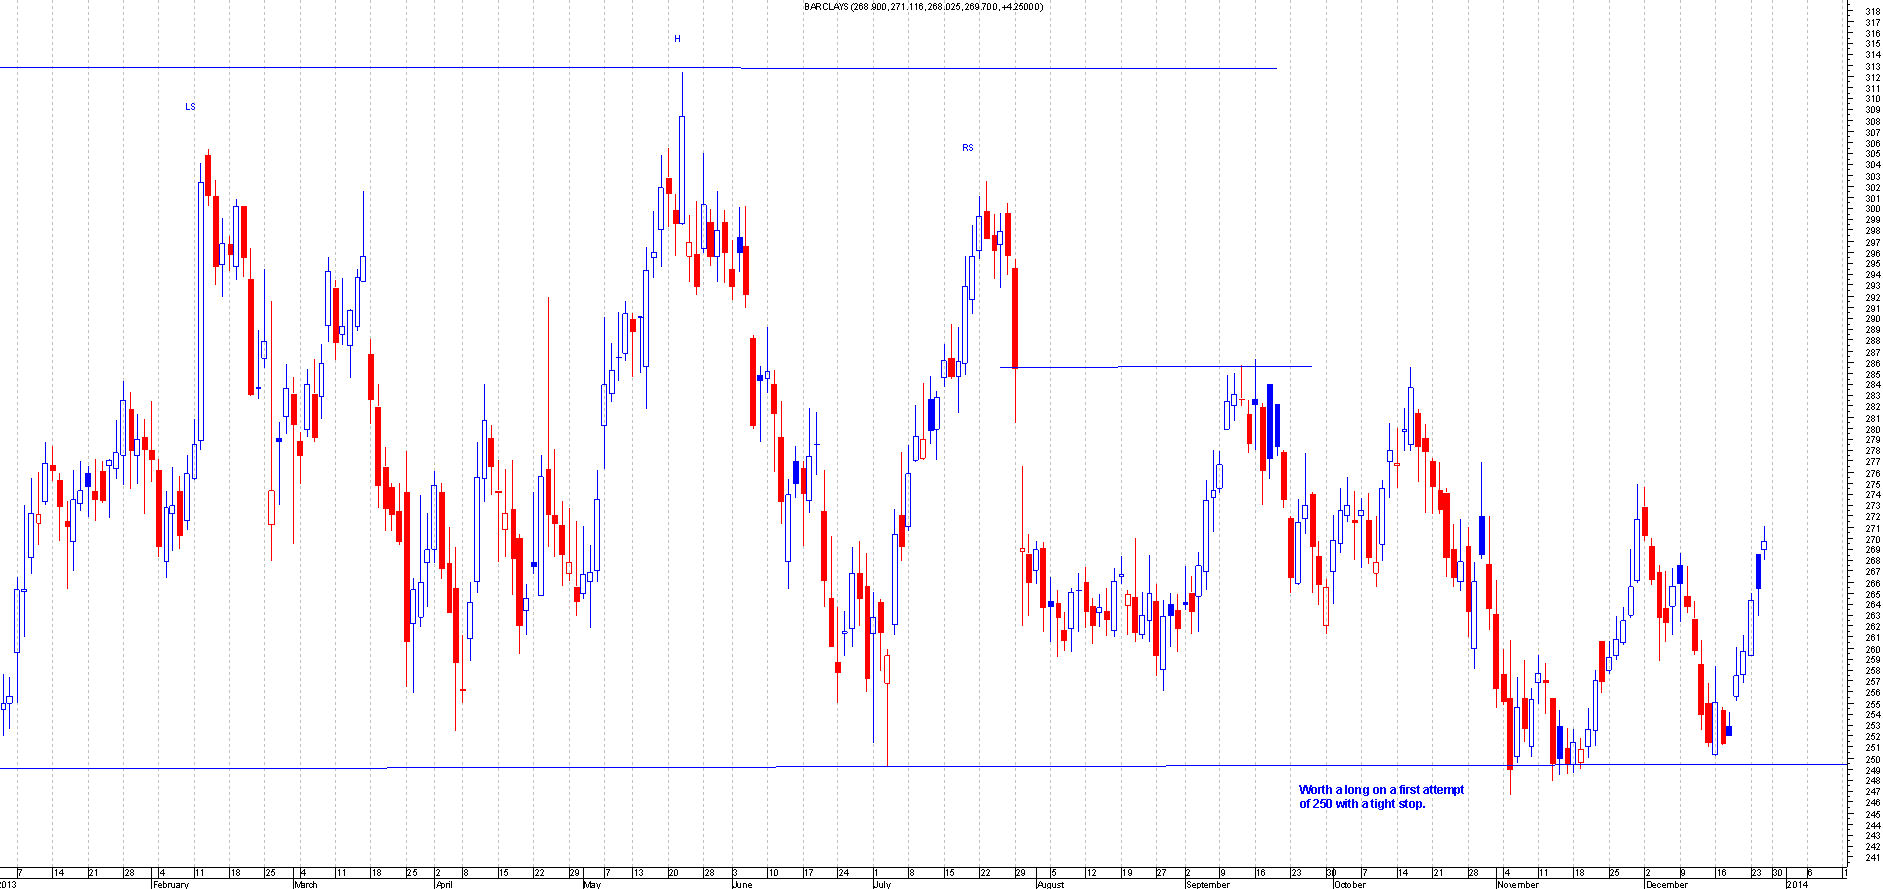
Before: This is the chart of barclays when i first mentioned it.
After : This bounced of 250 perfectly and has since moved 25+ points in profit
DJAN.L
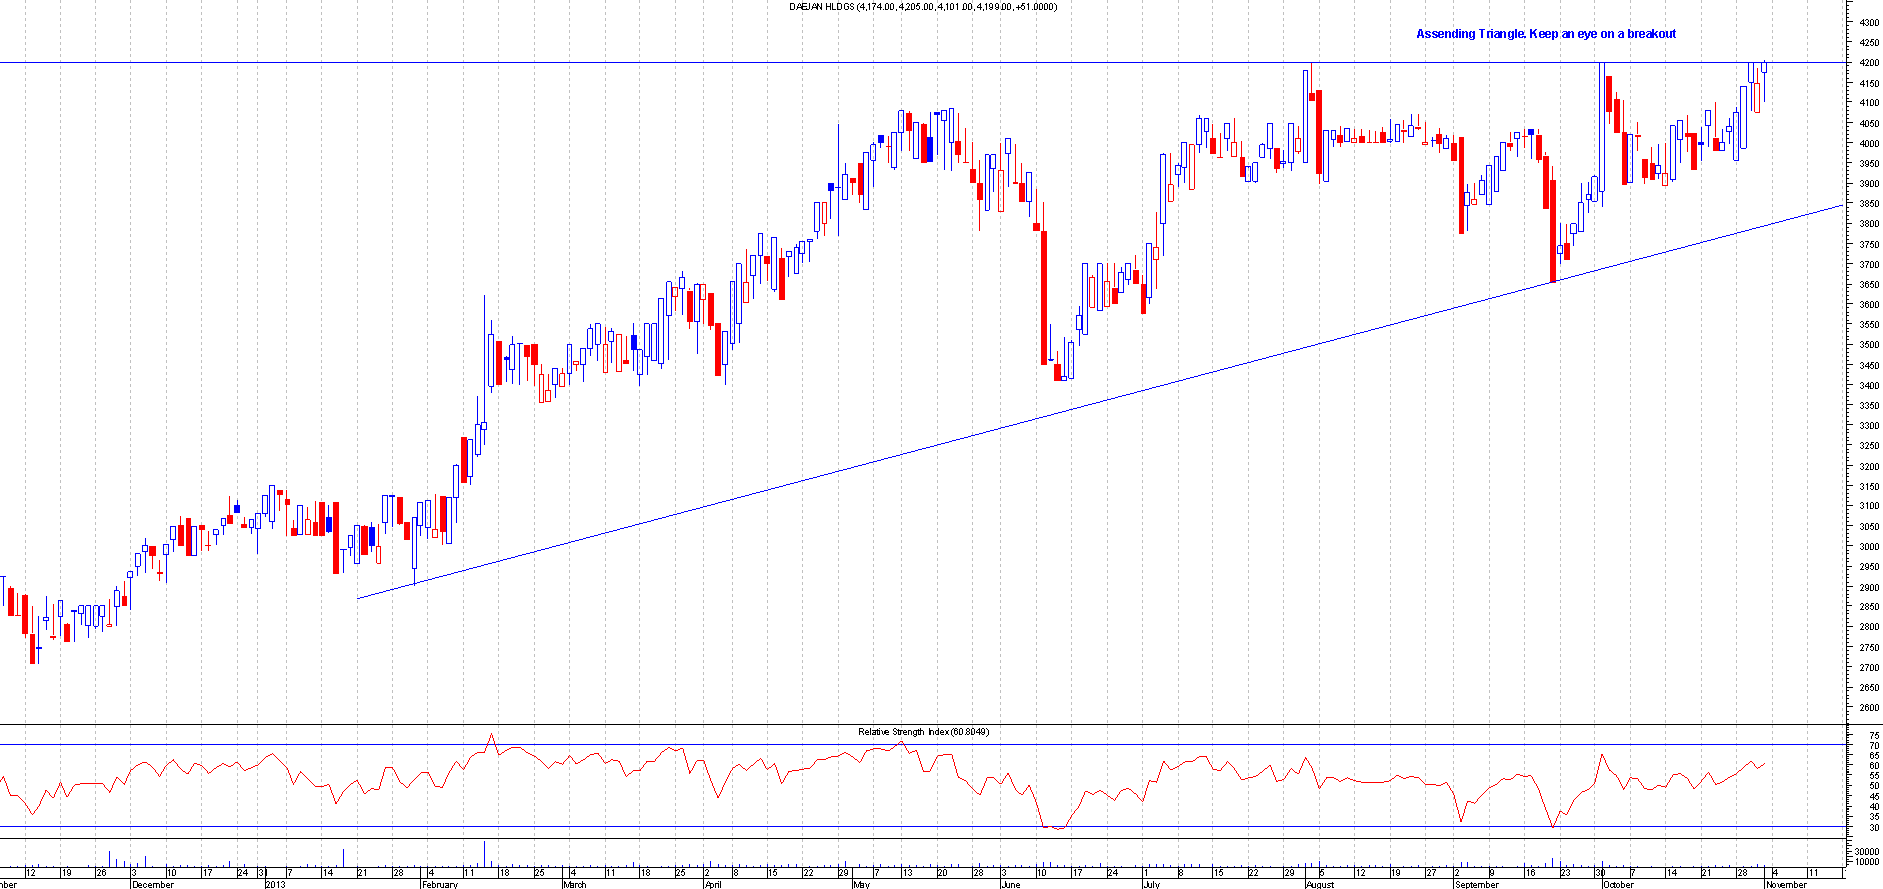
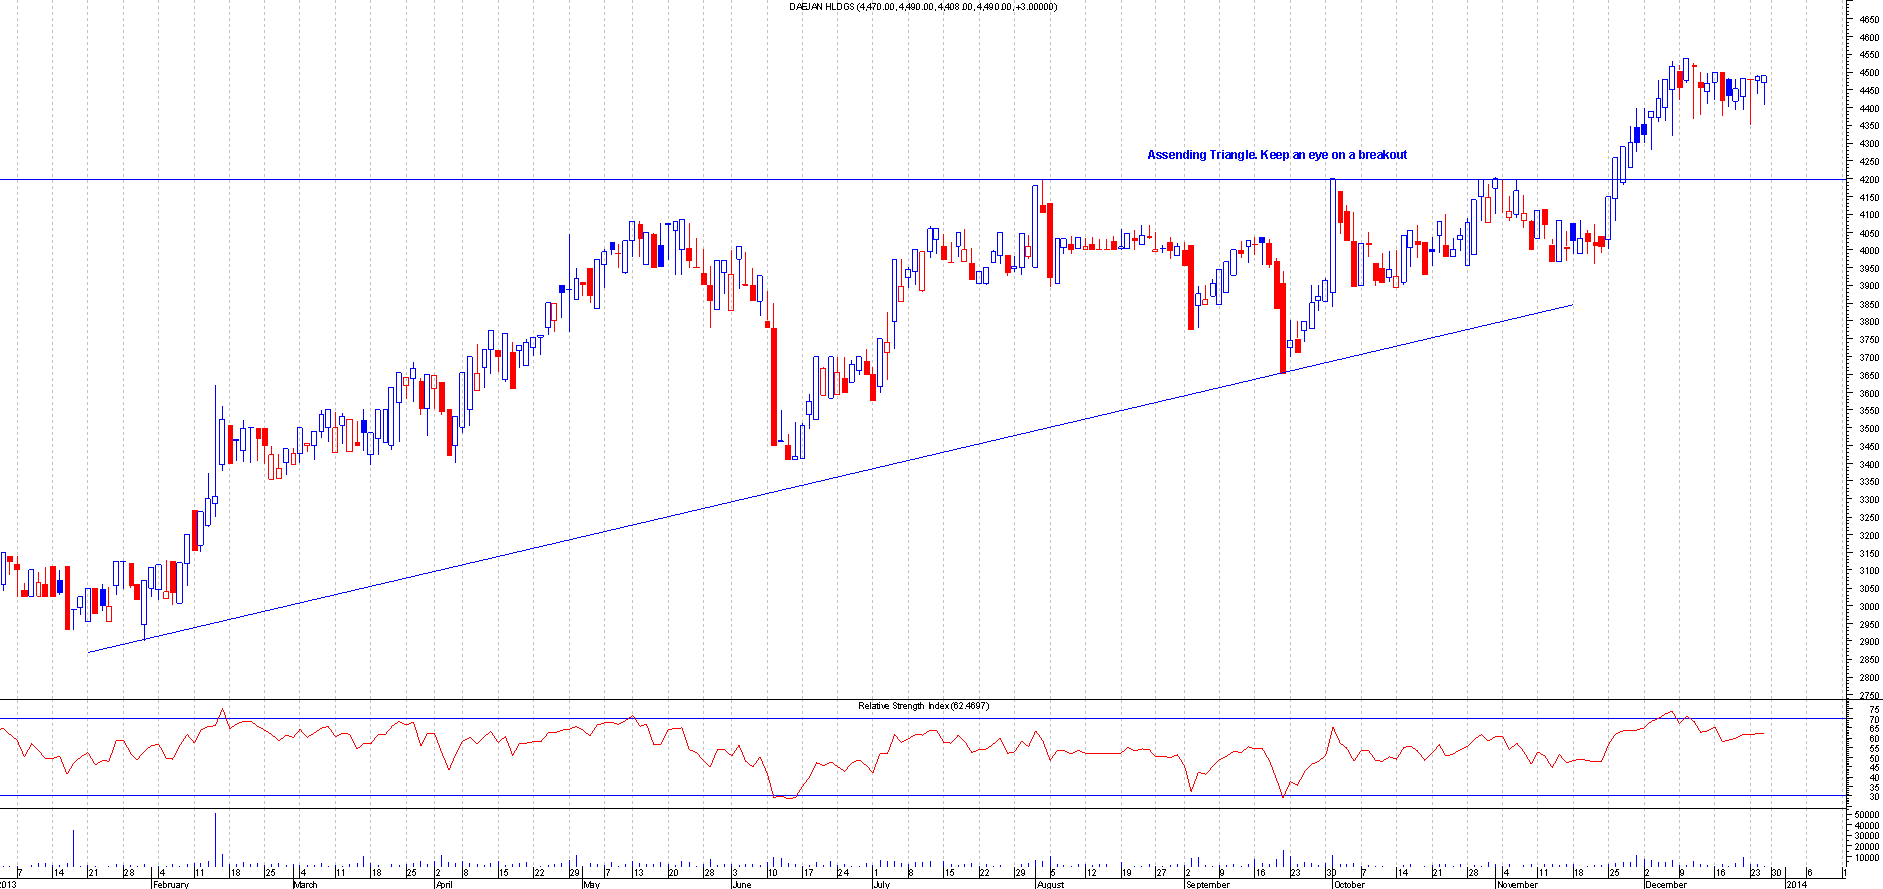
Before: This is the Chart of Daejan Holdings when I first mentioned this:
After : This broke out perfectly from the assending Triangle and has since moved over 340 + Points
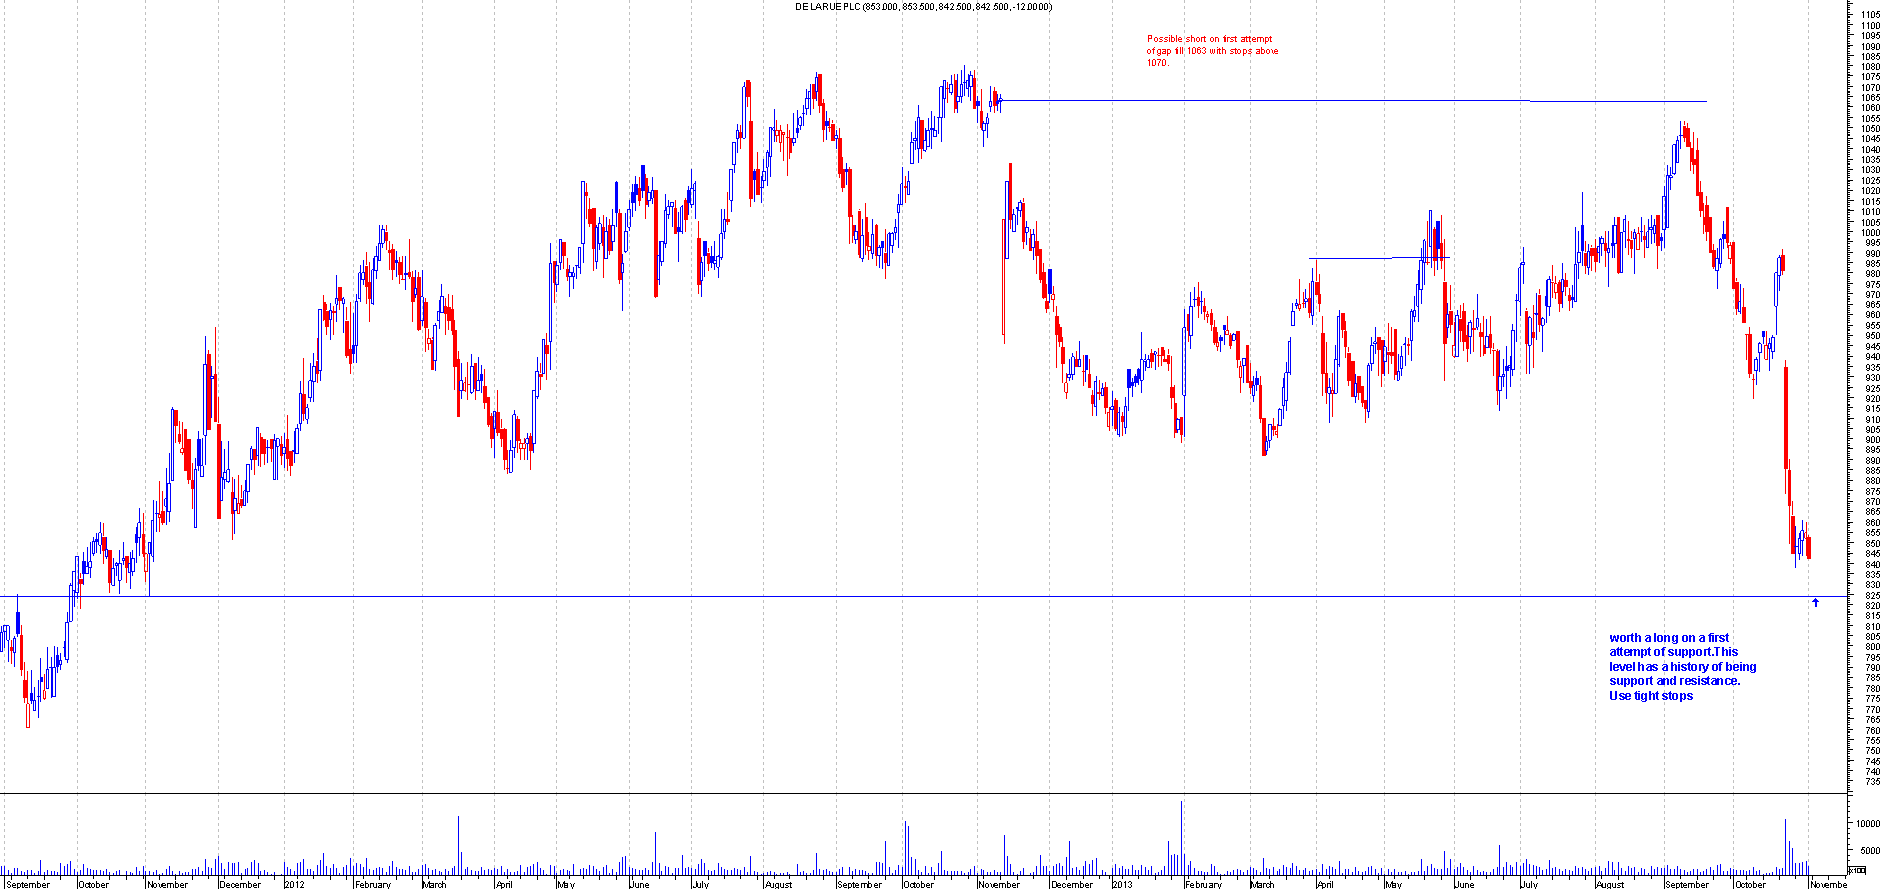
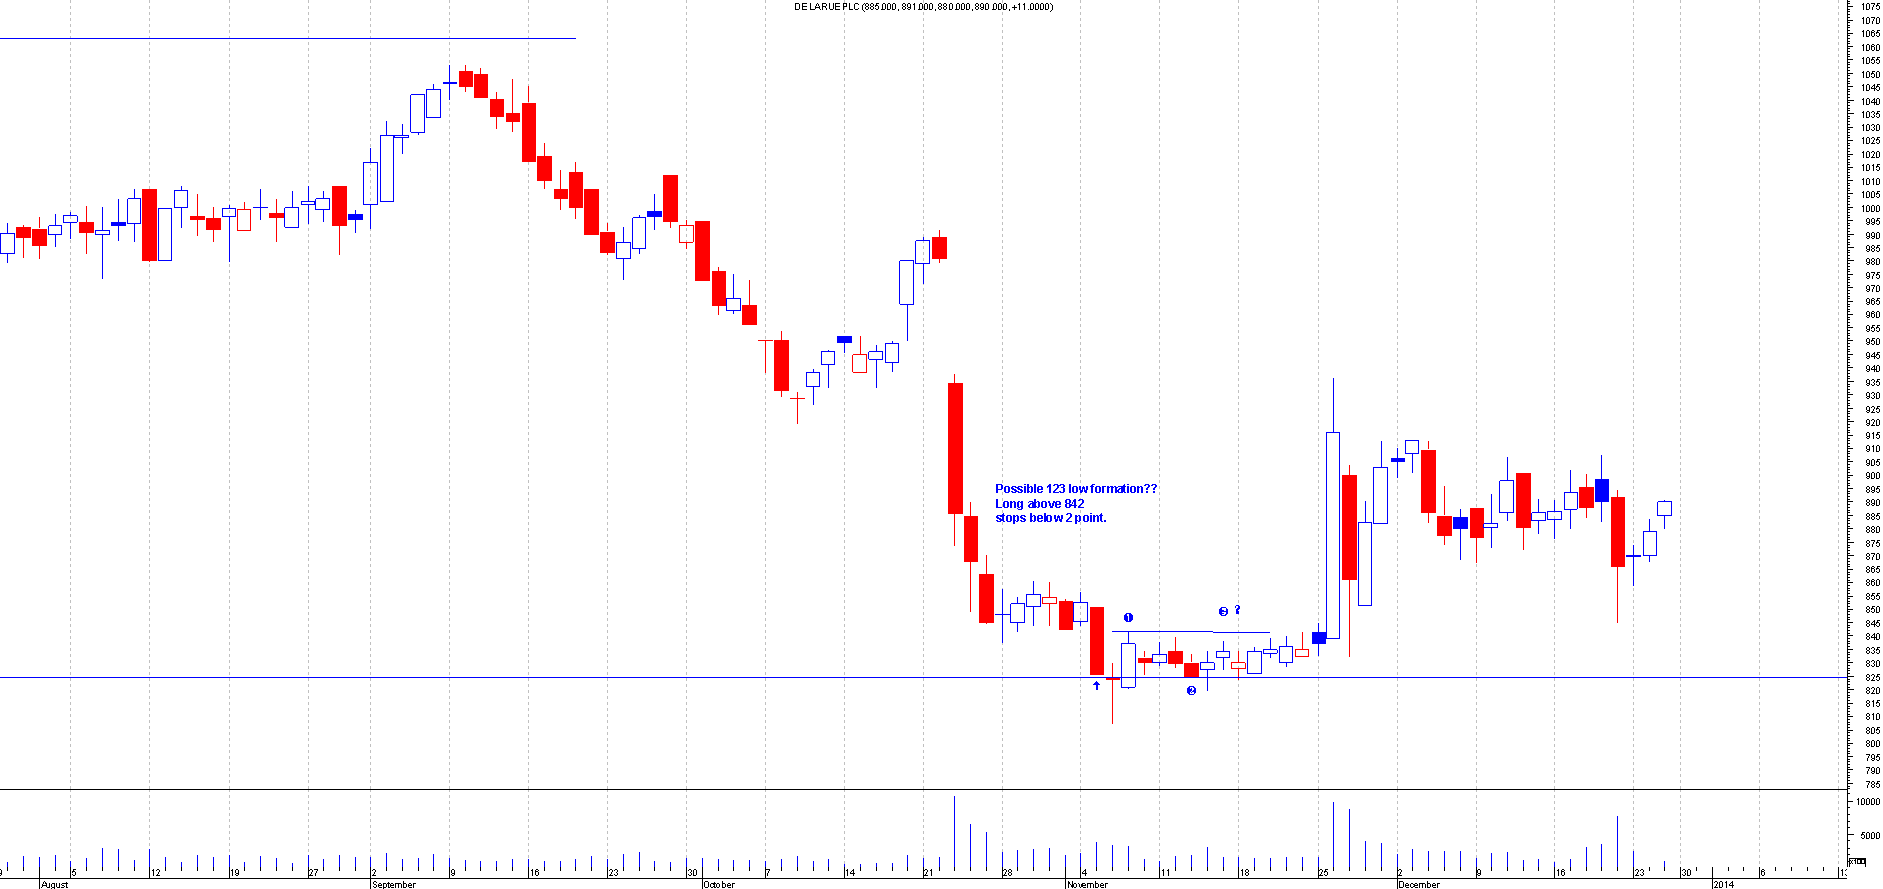
DLAR.L
Before: This is the Chart of De La Rue when I first mentioned this:
After : This bounced of the support perfectly on a first attempt basis and has since moved over 110 points in profit.
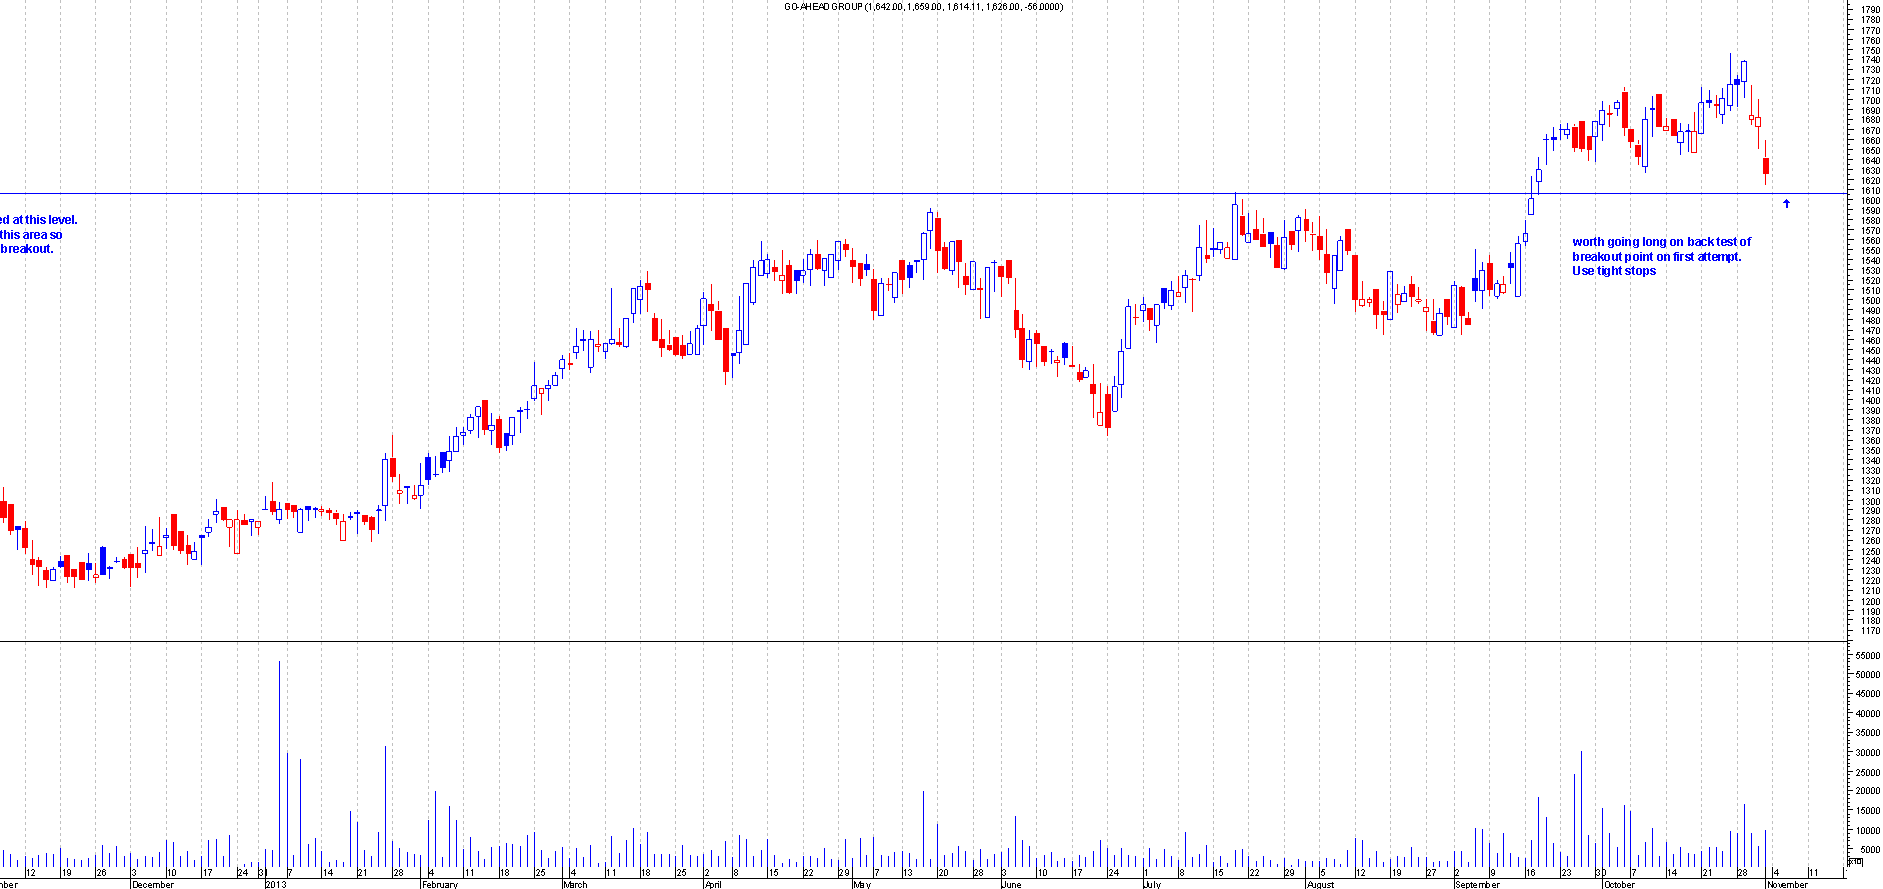
GOG.L
Before: This is the Chart of Go Ahead Group when I first mentioned this:
After : This just hanged around the support for most of the month and then finally exploaded out to give us a profit of over 170+points.
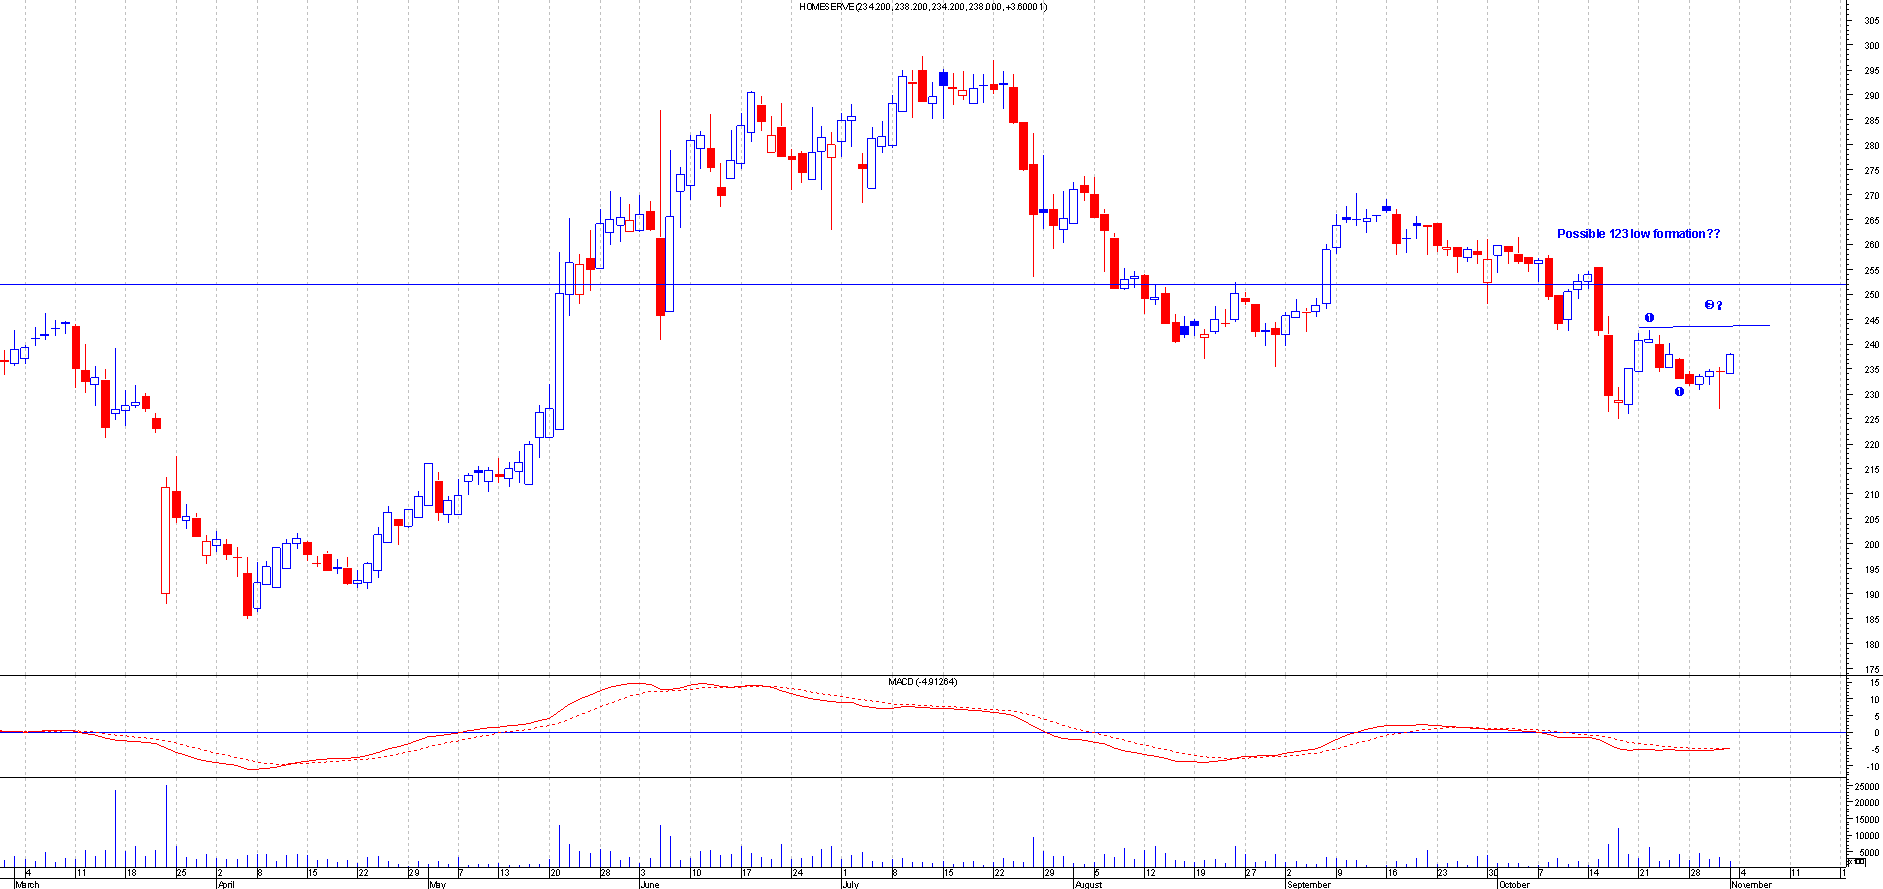
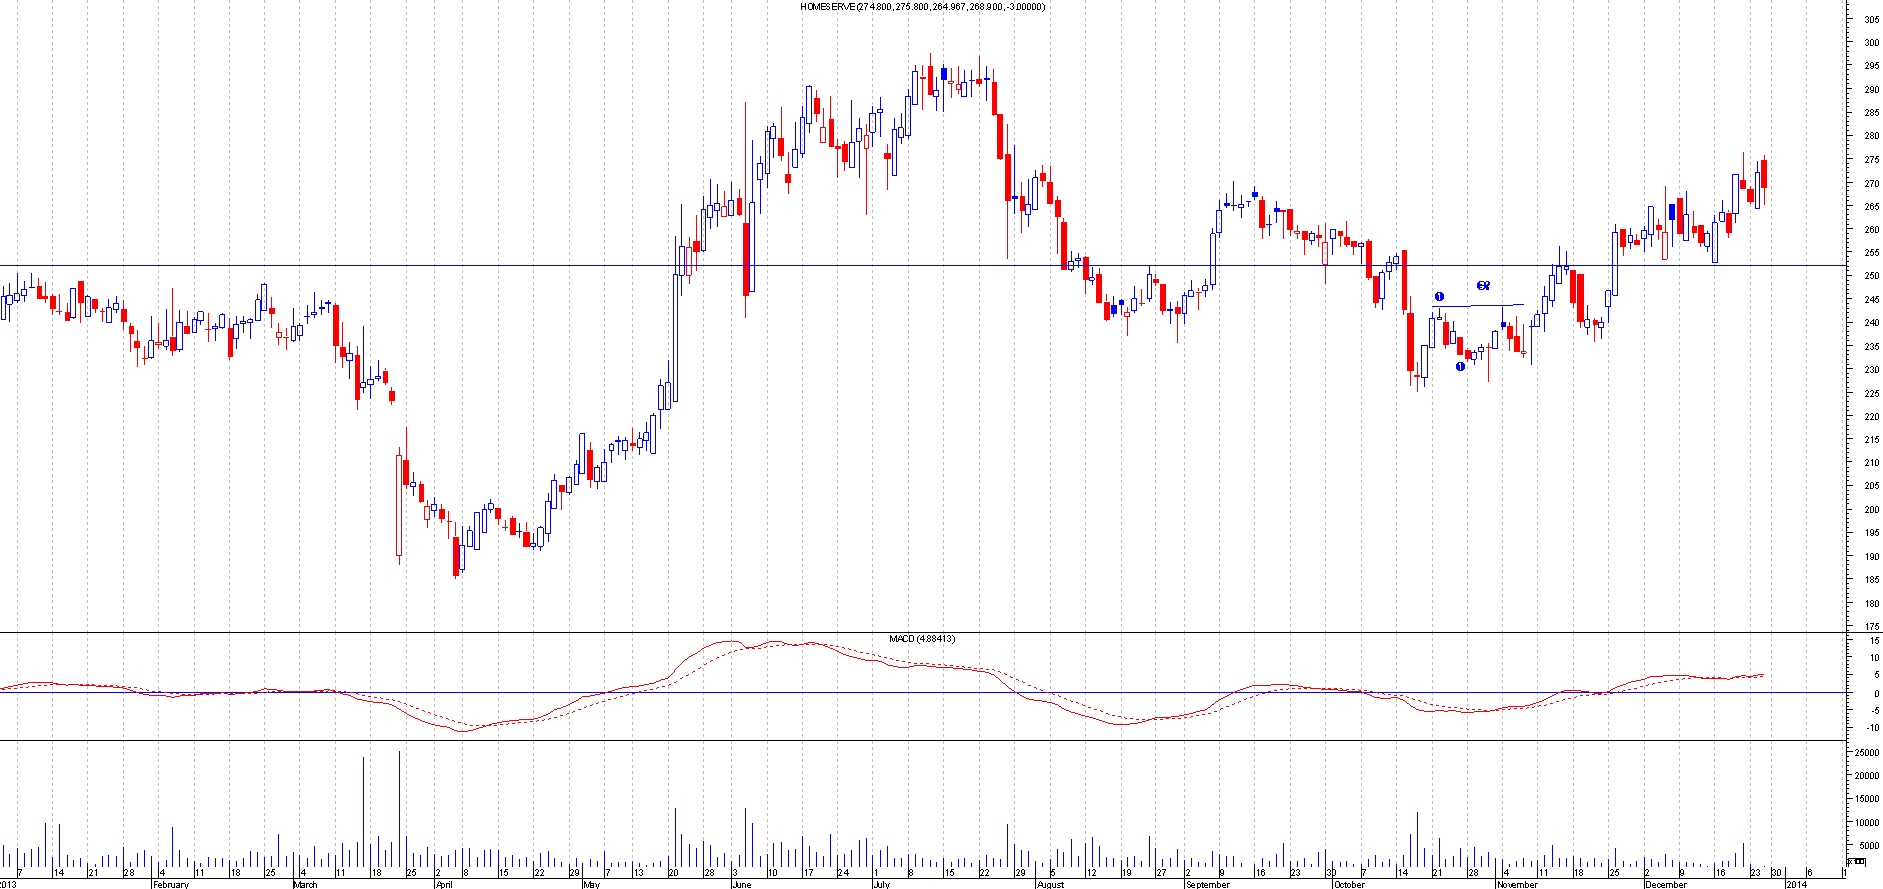
HSV.L
Before: This is the Chart of Home Serve when I first mentioned this:
After : This broke out of a 123 low formation and has moved over 33 points in profit.
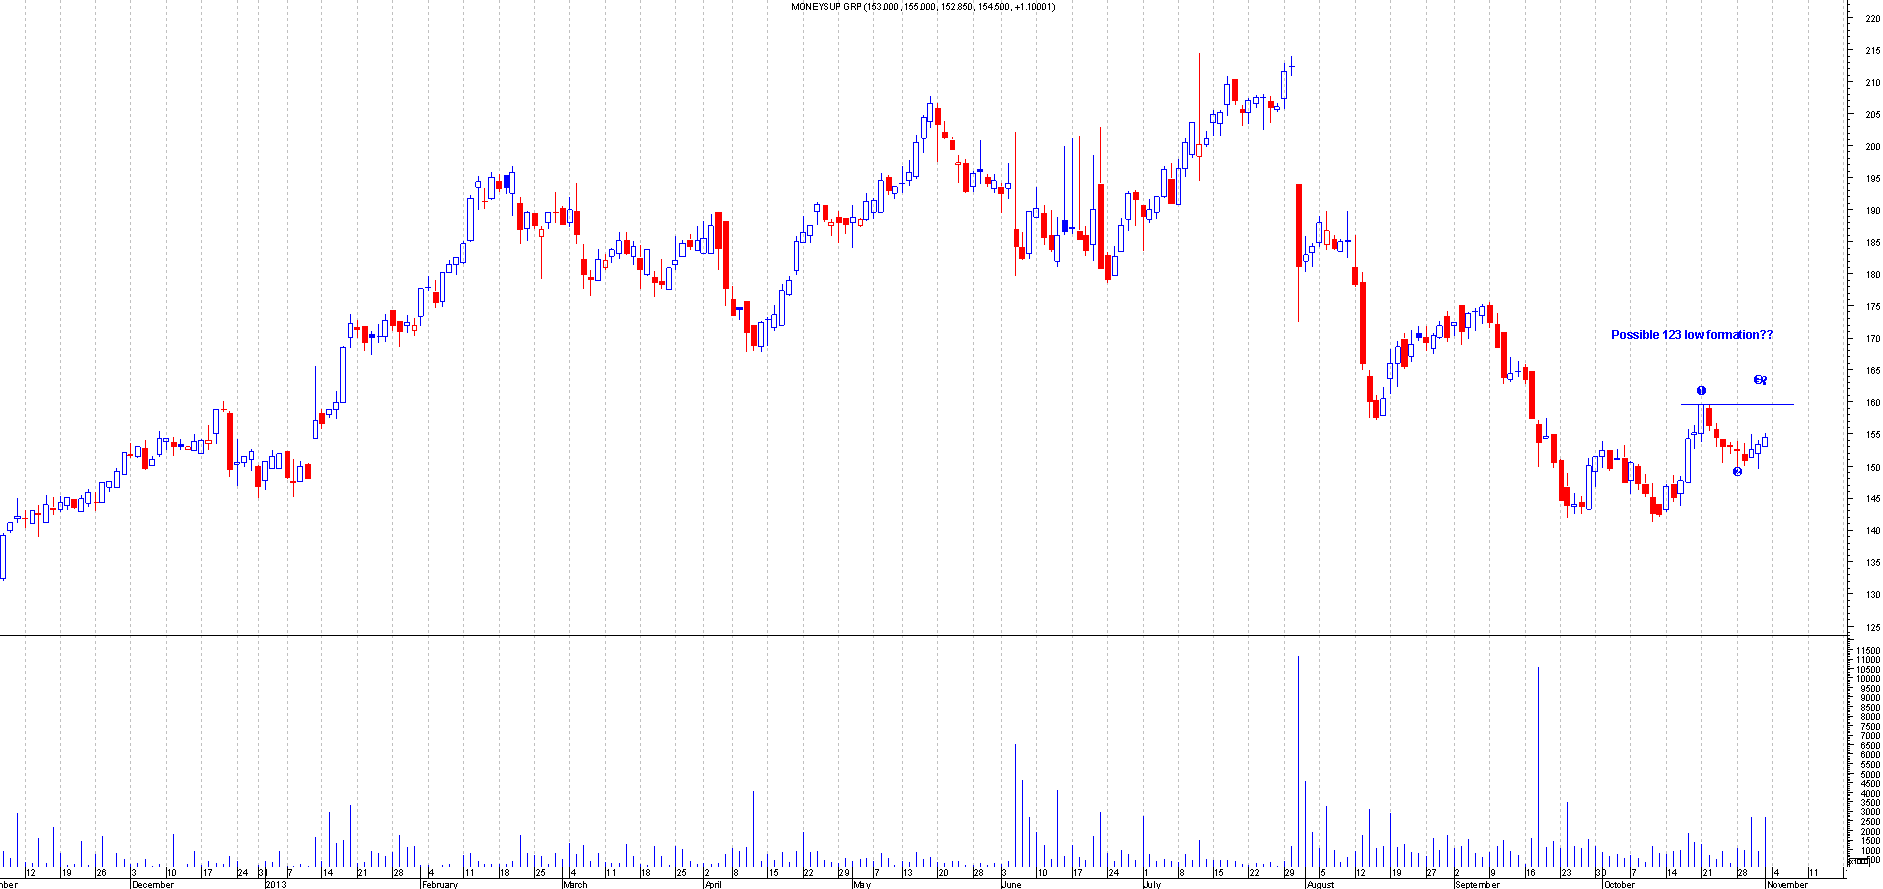
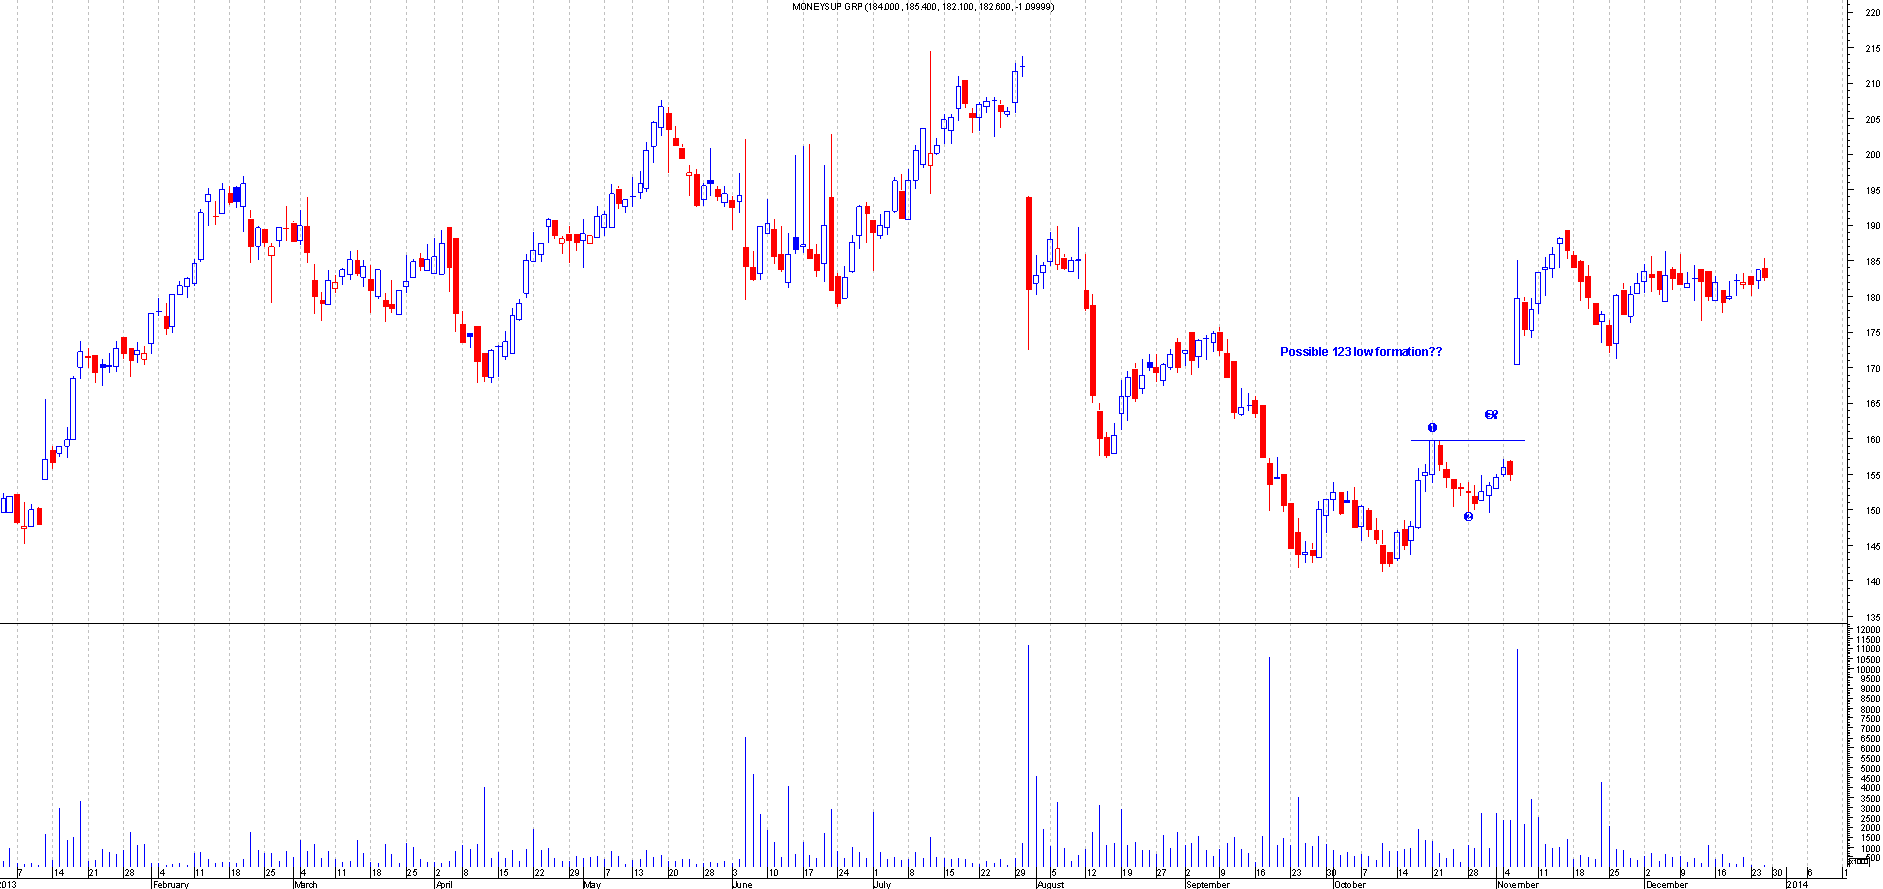
MONY.L
Before: This is the Chart of Moneysupermarket when I first mentioned this:
After : This gapped above the entry and moved higher. This one would have been hard to enter. This would have been one of those unlucky missed trades.
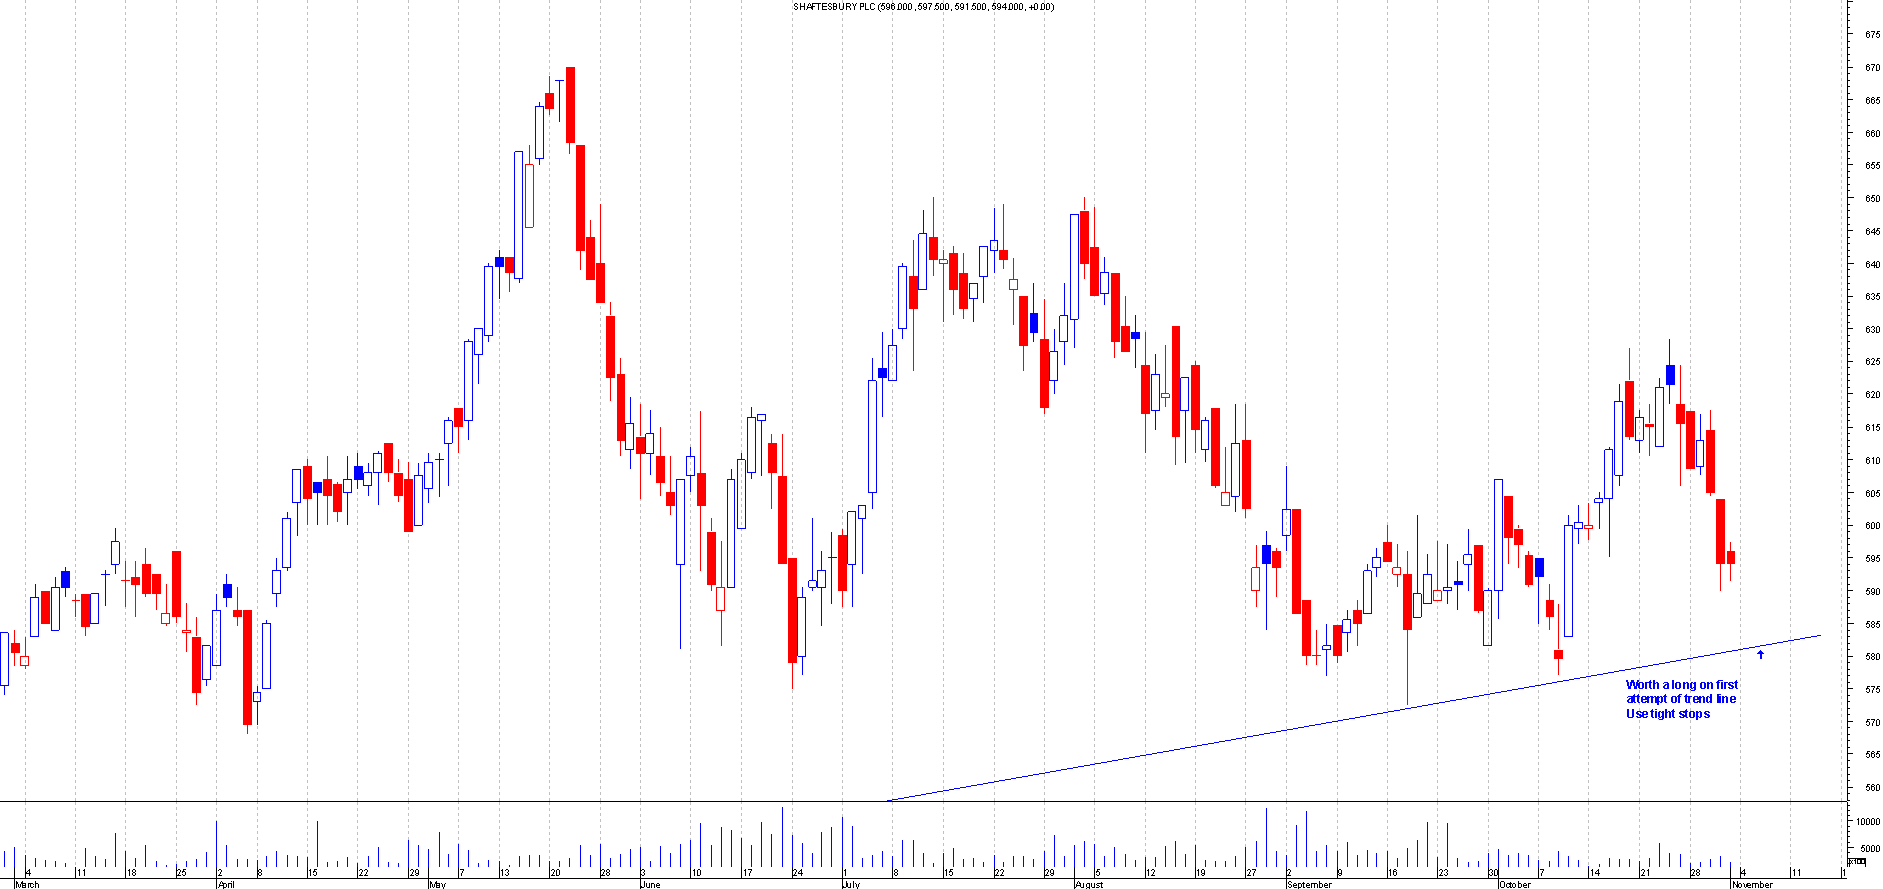
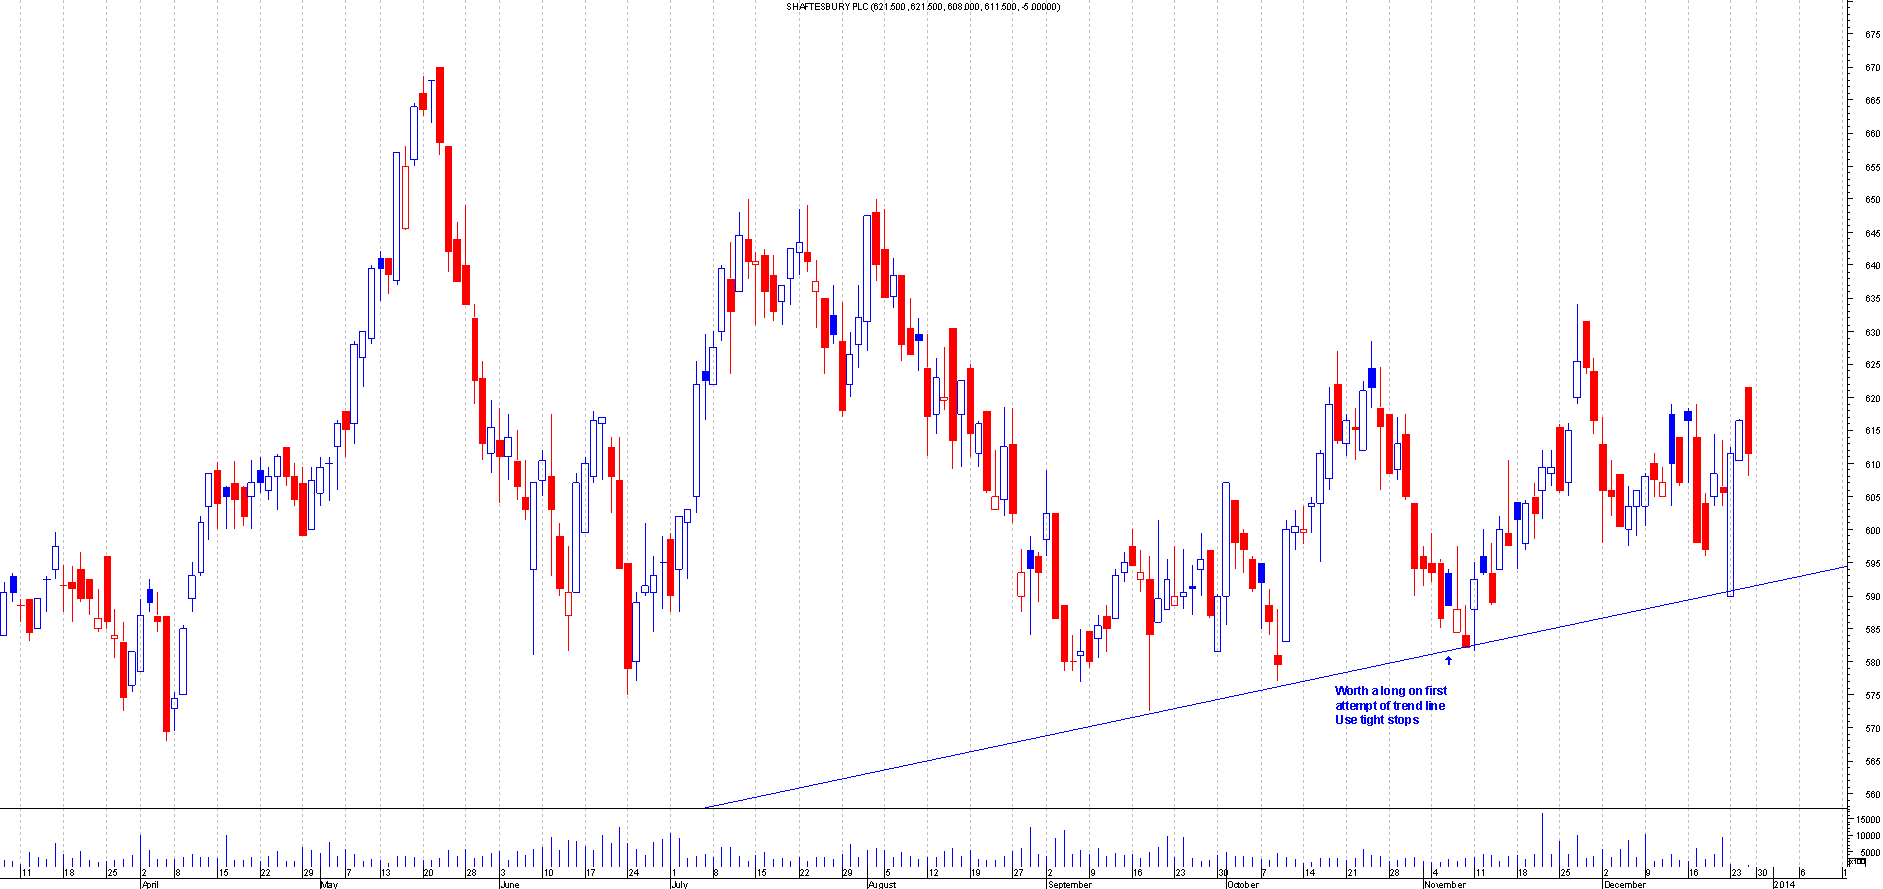
SHB.L
Before: This is the Chart of Shaftesbury when I first mentioned this:
After : This bounced of perfectly from the trend line on the first attempt. This was an inch perfect trade. This has since moved 55+ points.
JDW.L
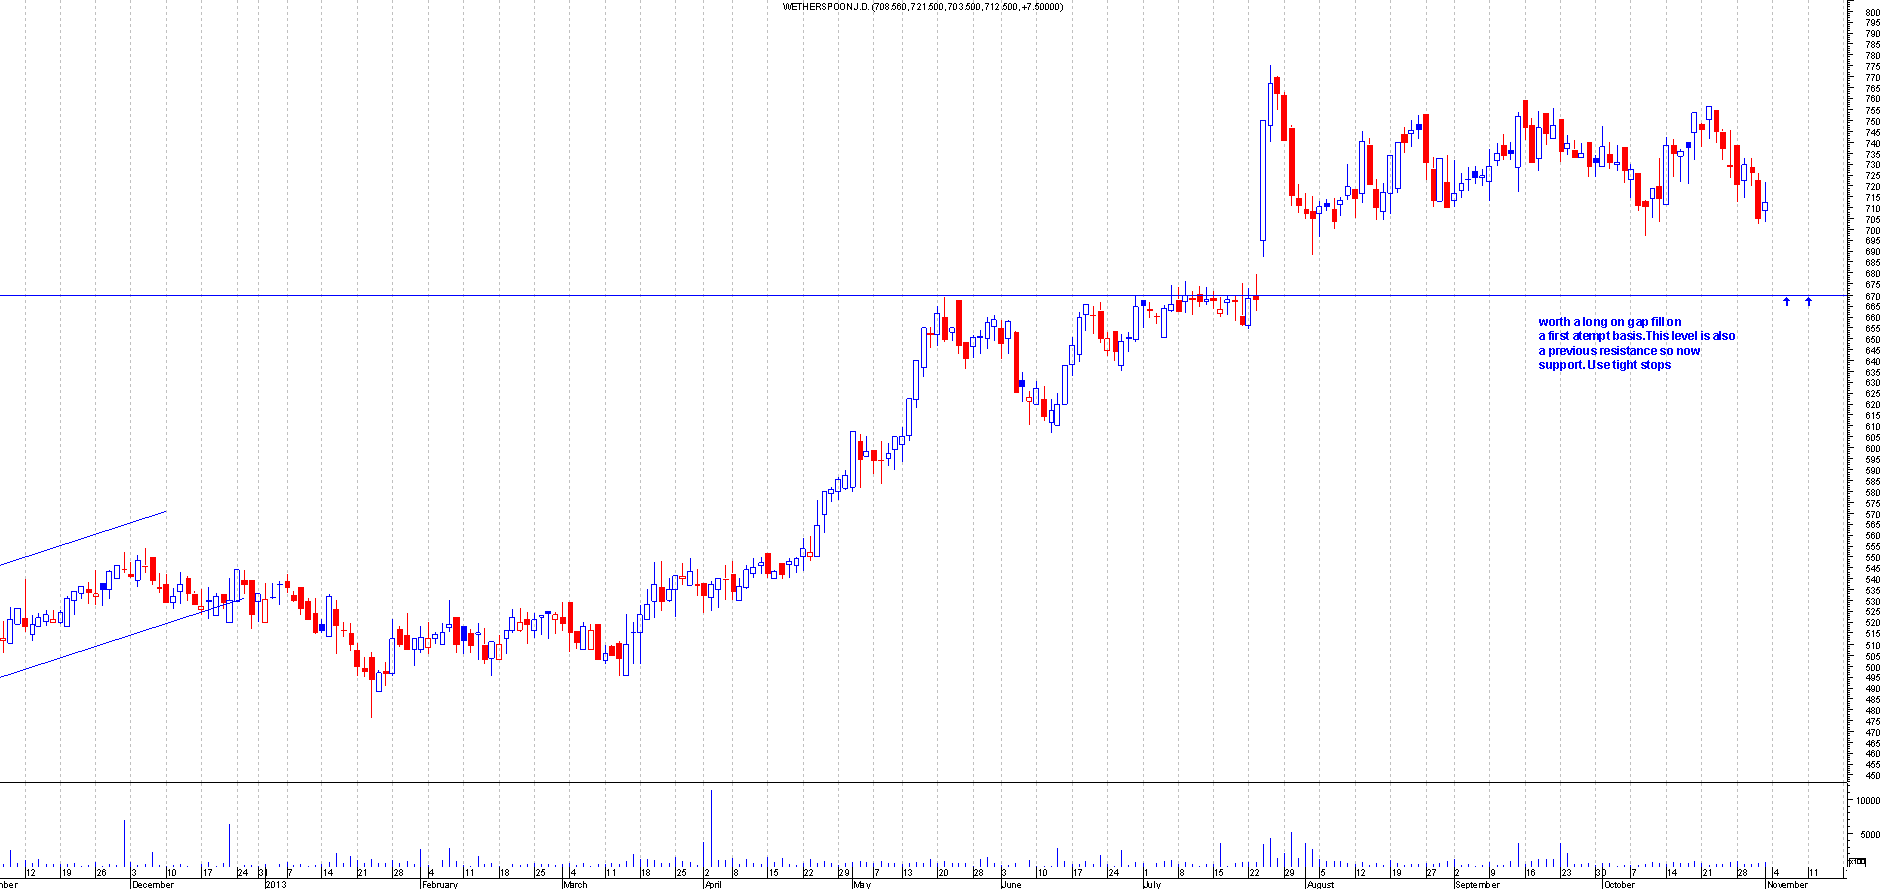
Before: This is the Chart of Wetherspoon when I first mentioned this:
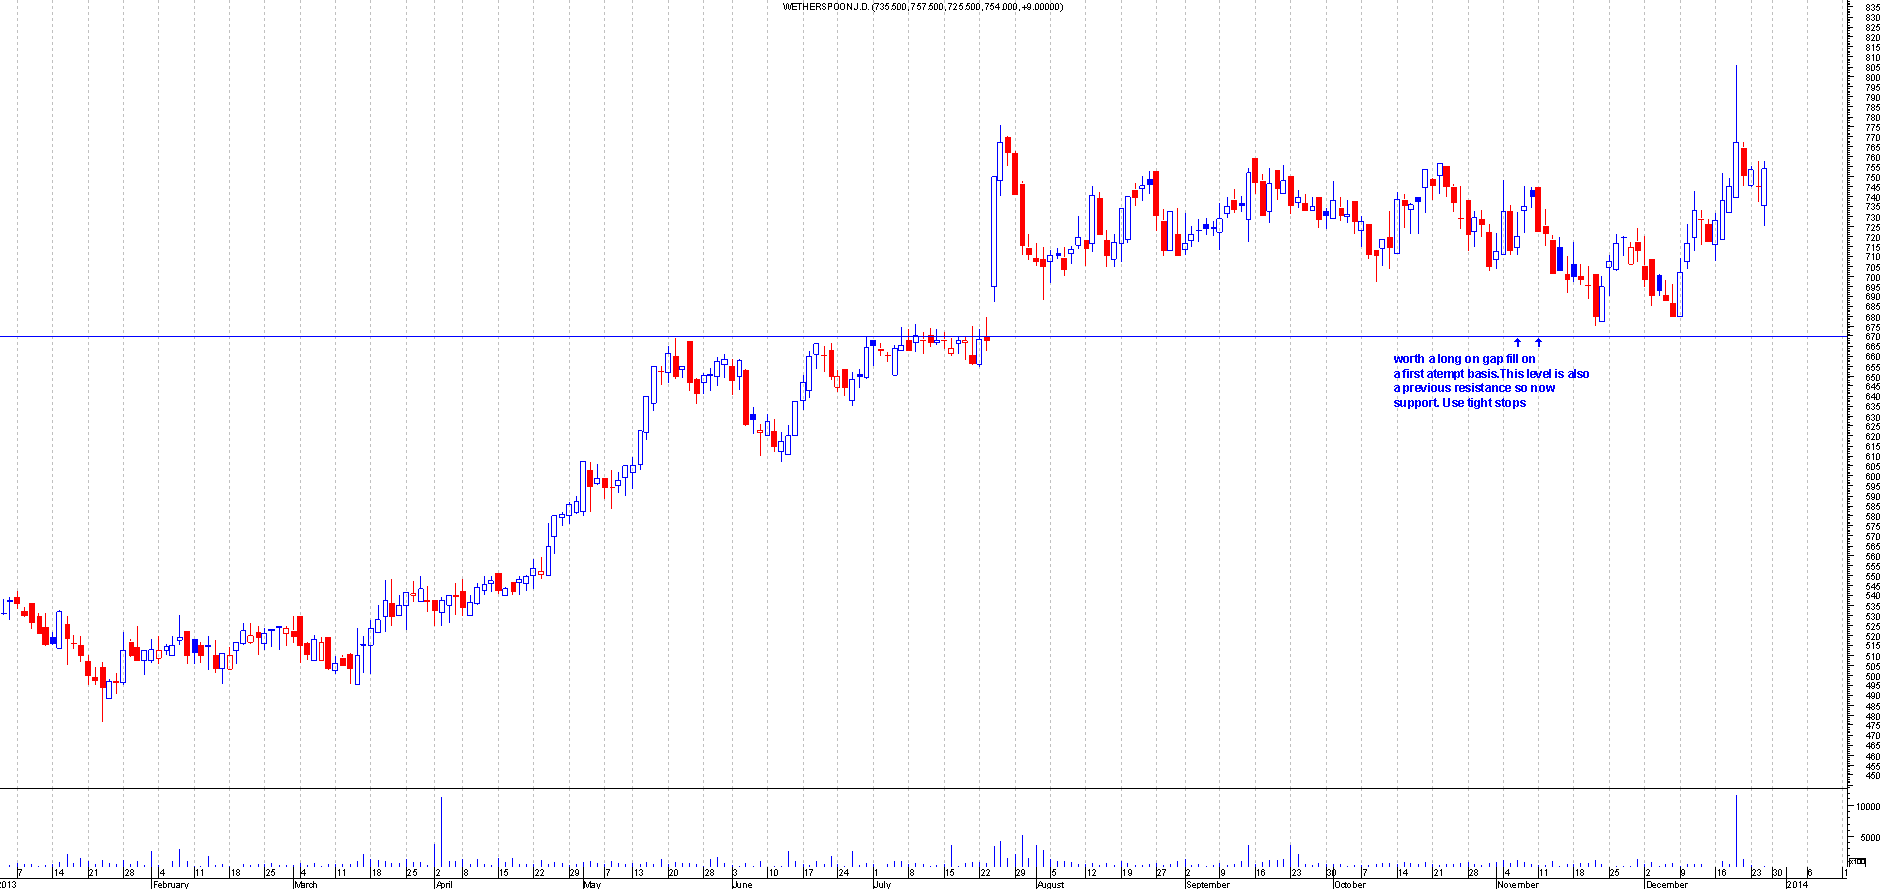
After : This filled the gap perfectly based on the windows method. This has since moved 125 + points
11th November - 17th November
CPG.L
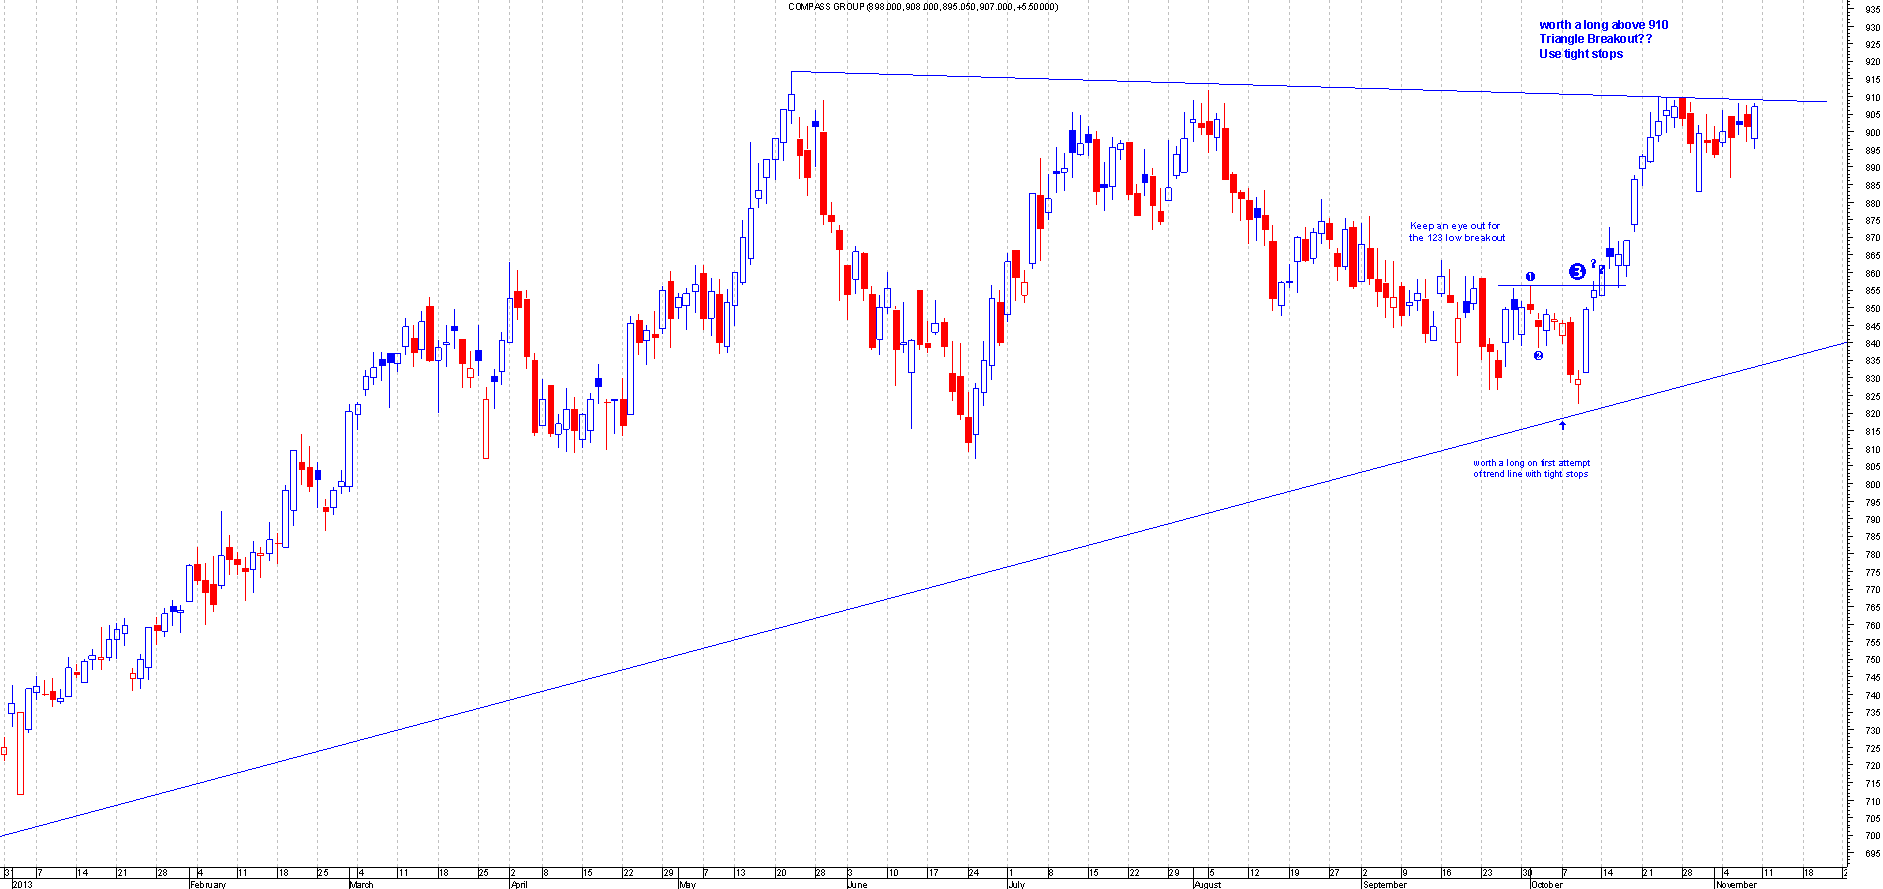
Before: This is the Chart of Compass Group when I first mentioned this:
After : This broke out of the triangle nicely and has since moved over 50 + points. This even back tested the breakout.
IPO.L
Before: This is the Chart of IP Group when I first mentioned this:
After : This broke out strongly and moved quickly away. This went as high as 40 points. This has also recently backtested the breakout point.
18th November - 24th November 2013
BRW.L
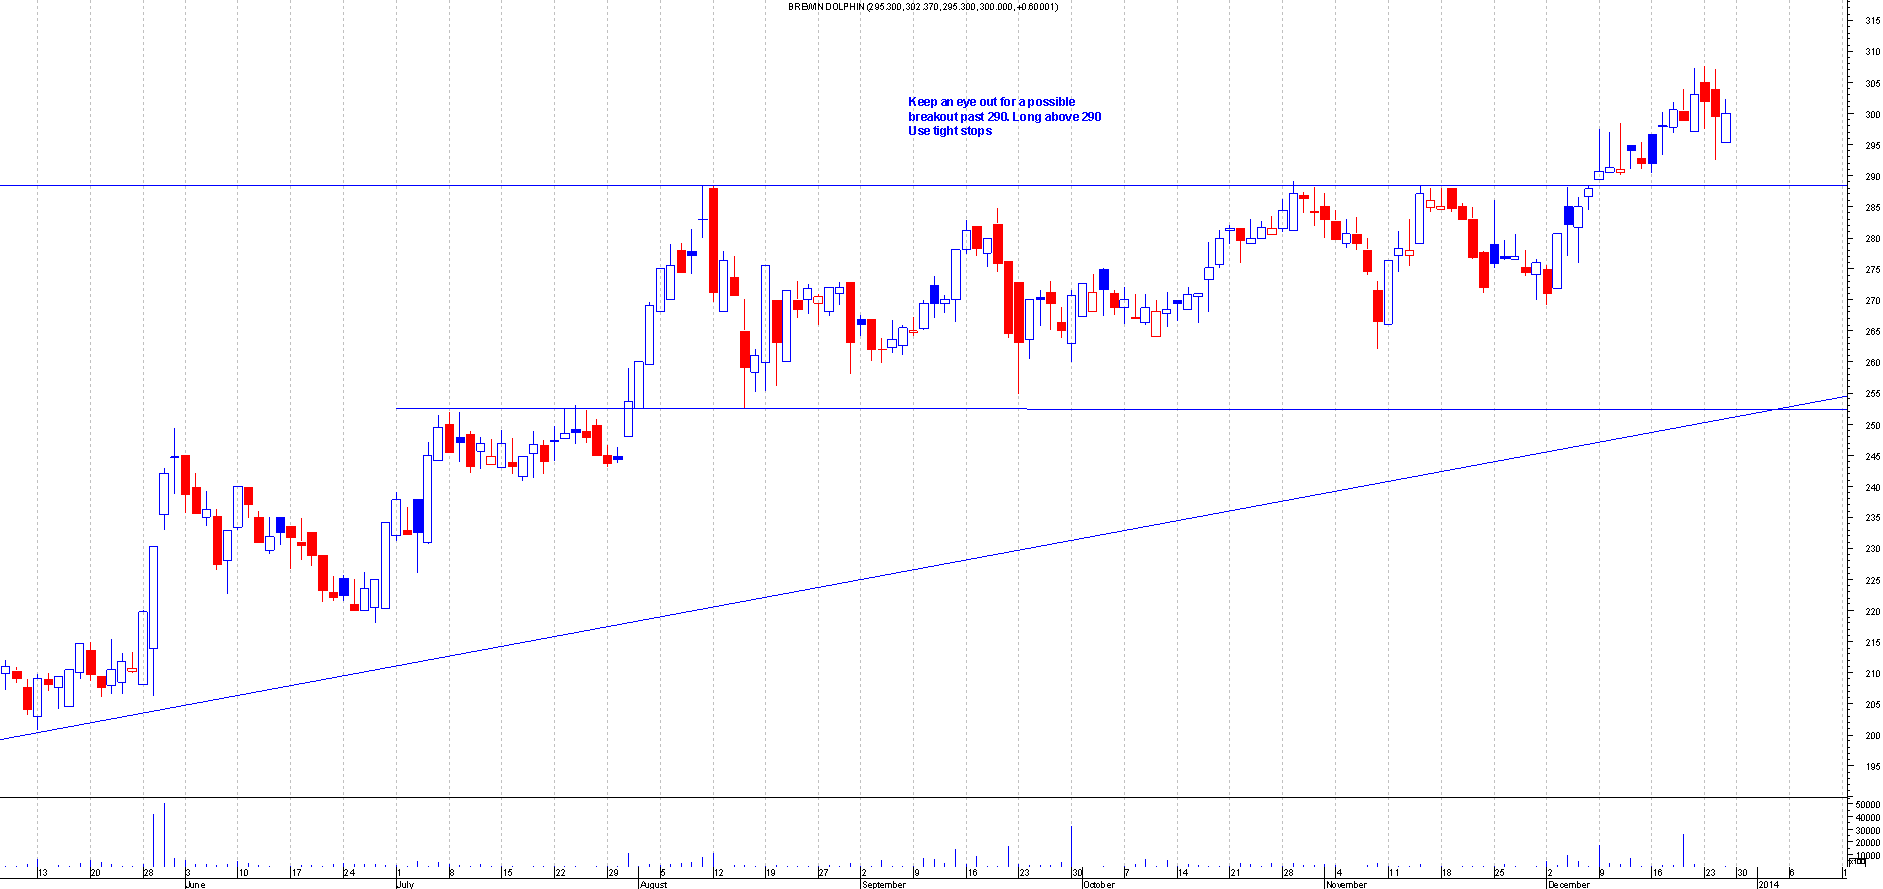
Before: This is the Chart of Brewin Dolphin when I first mentioned this:
After : This broke out nicely from an assending triangle and has since moved over 20 points.
DLAR.L
Before: This is the Chart of De La Rue when I first mentioned this:
After : This broke out of a 123 low formation and has since moved over 100 points.
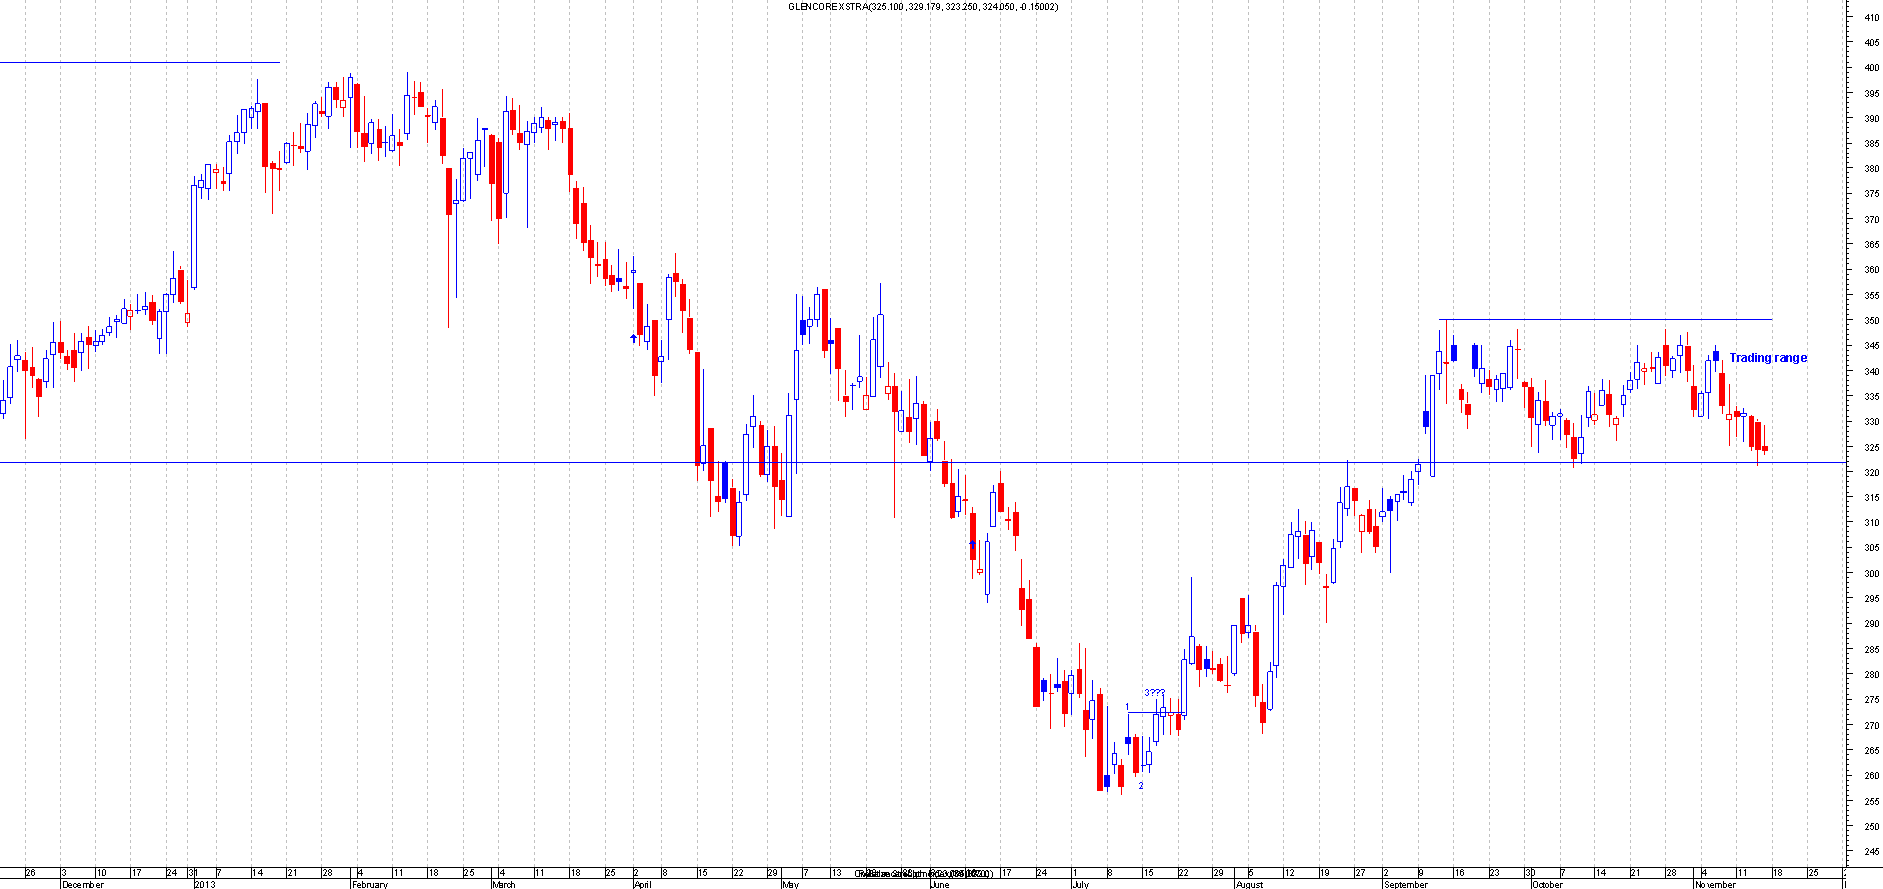
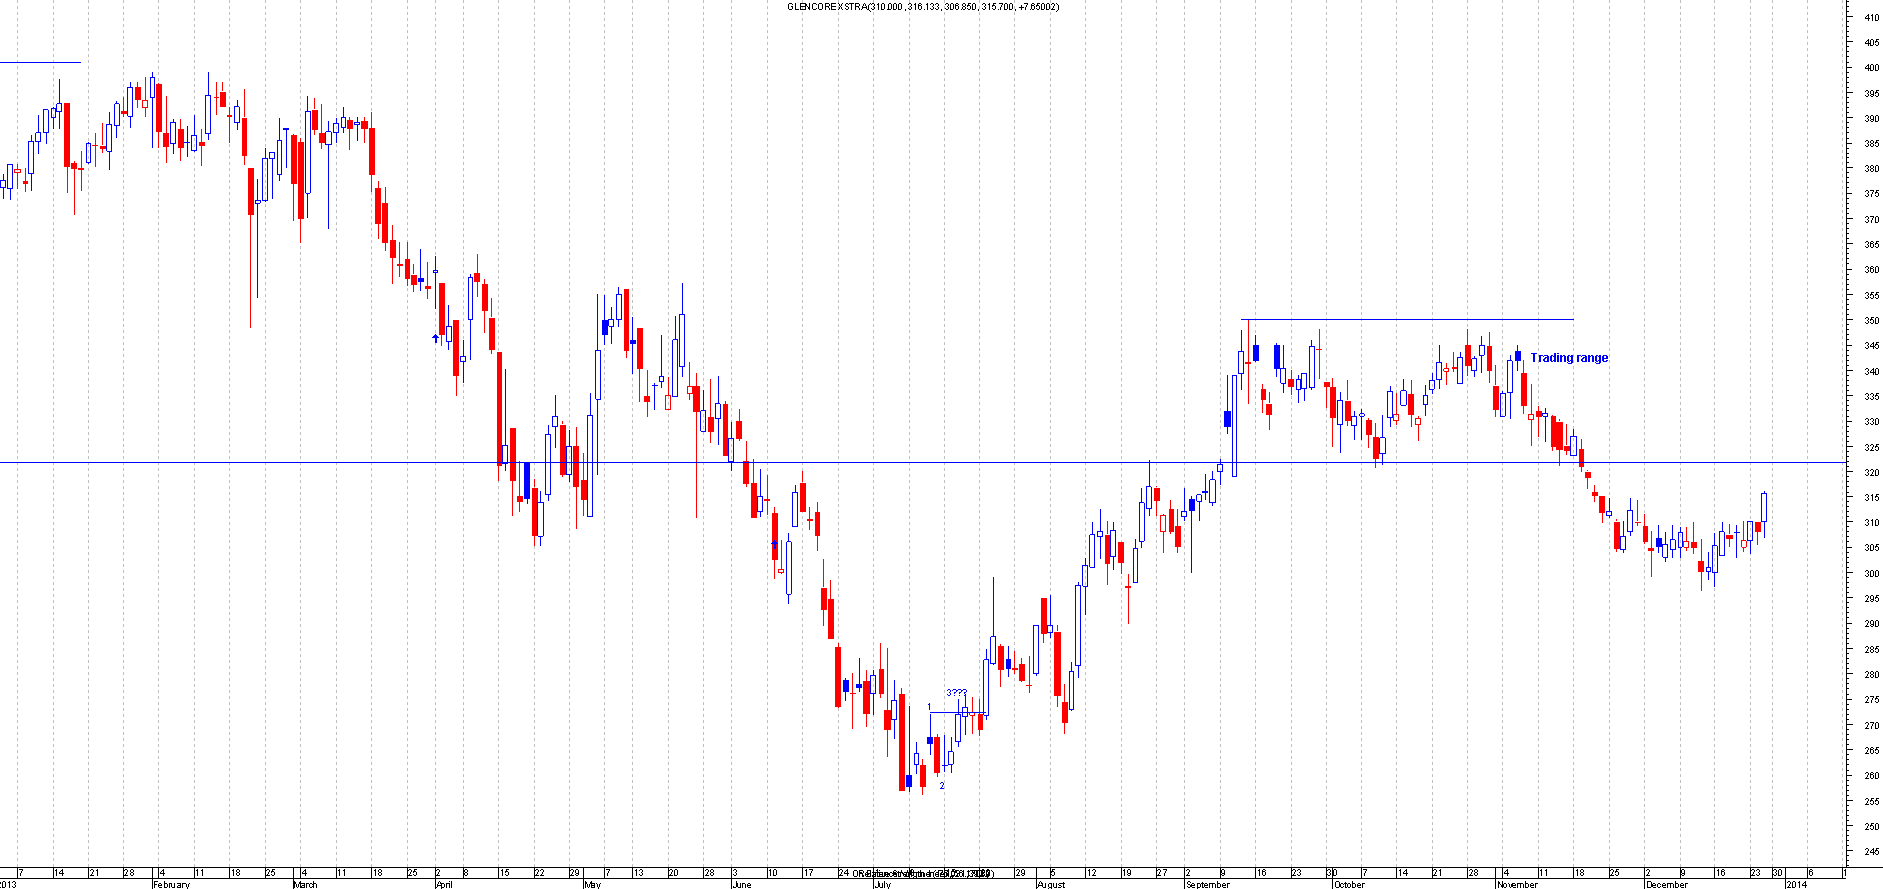
GLEN.L
Before: This is the Chart of Glencore xstra when I first mentioned this:
After : This broke out of the trading range and moved lower. This had gone low as 26 points. Roughly the trading range target.
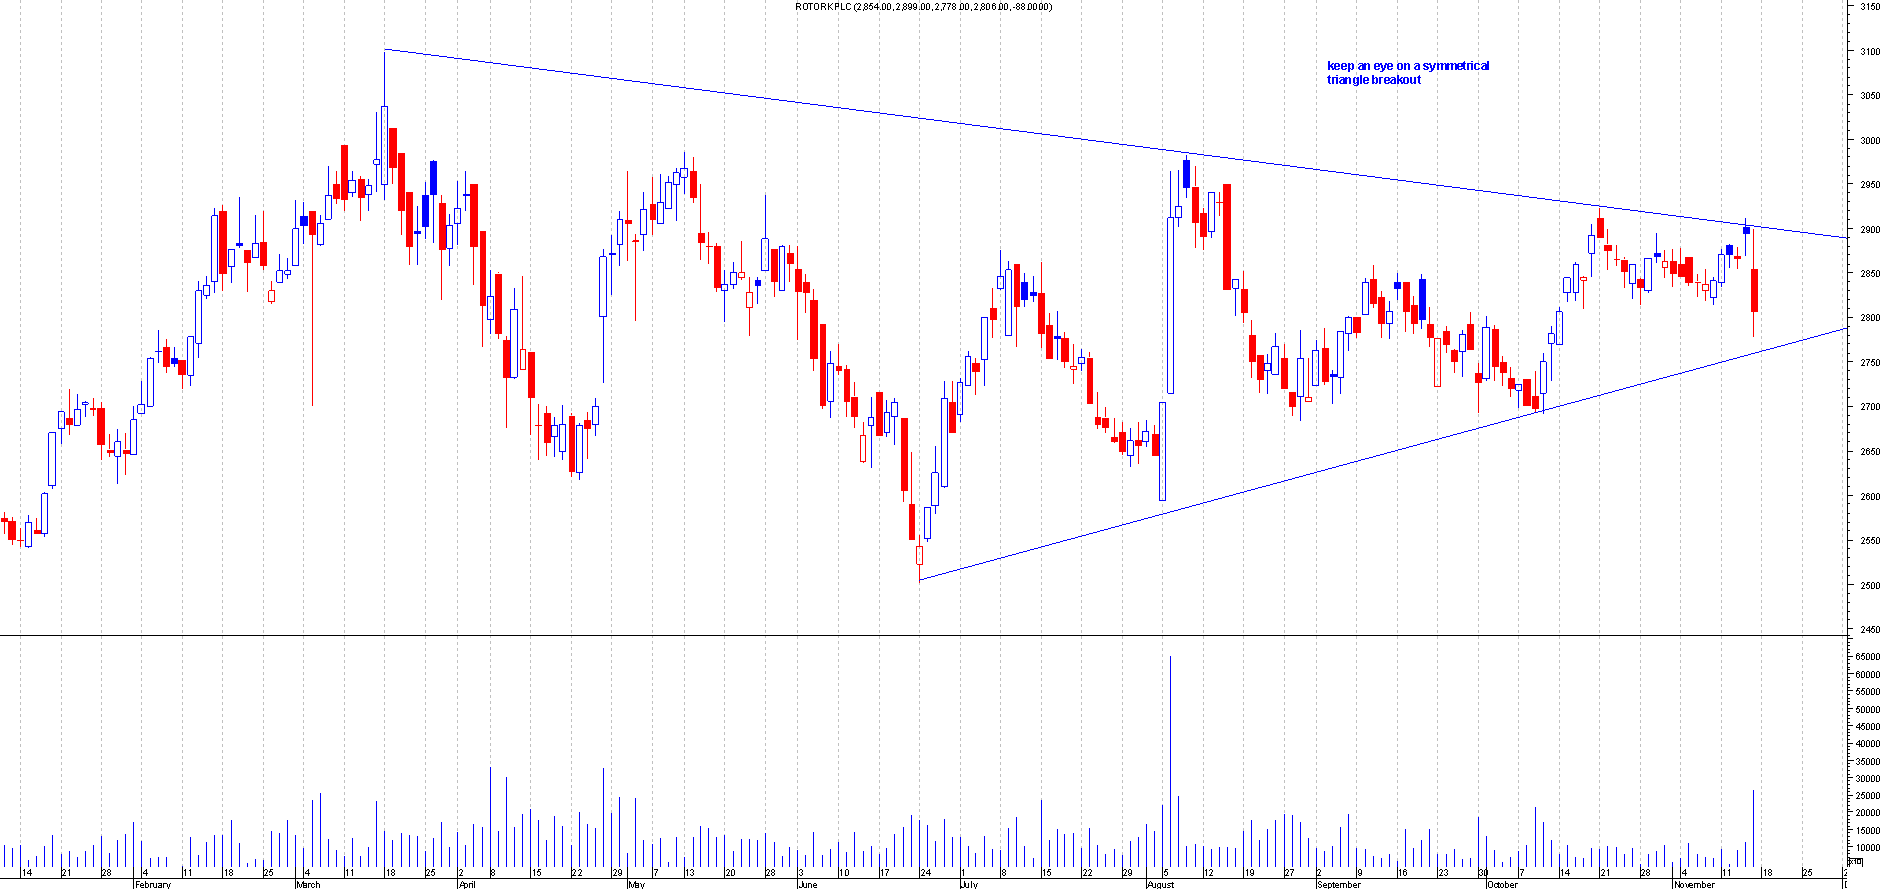
ROR.L
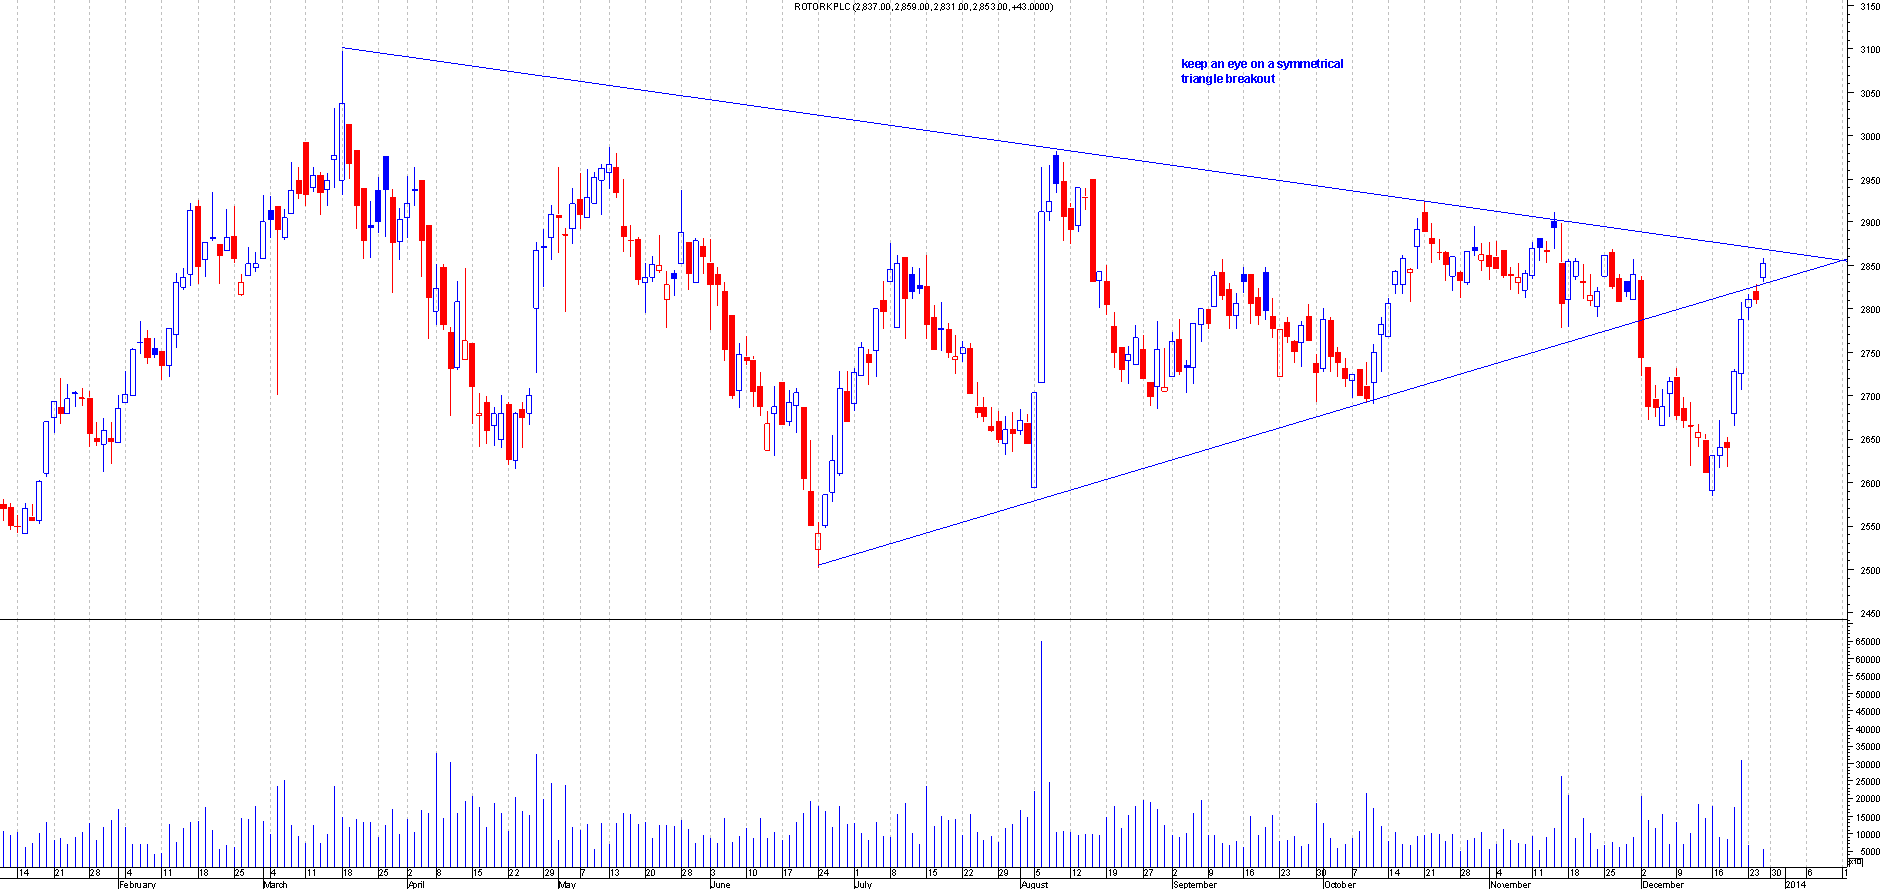
Before: This is the Chart of Rotork PLC when I first mentioned this:
After : This broke out of the symmetrical triangle and netted over 200 points.
SXS.L
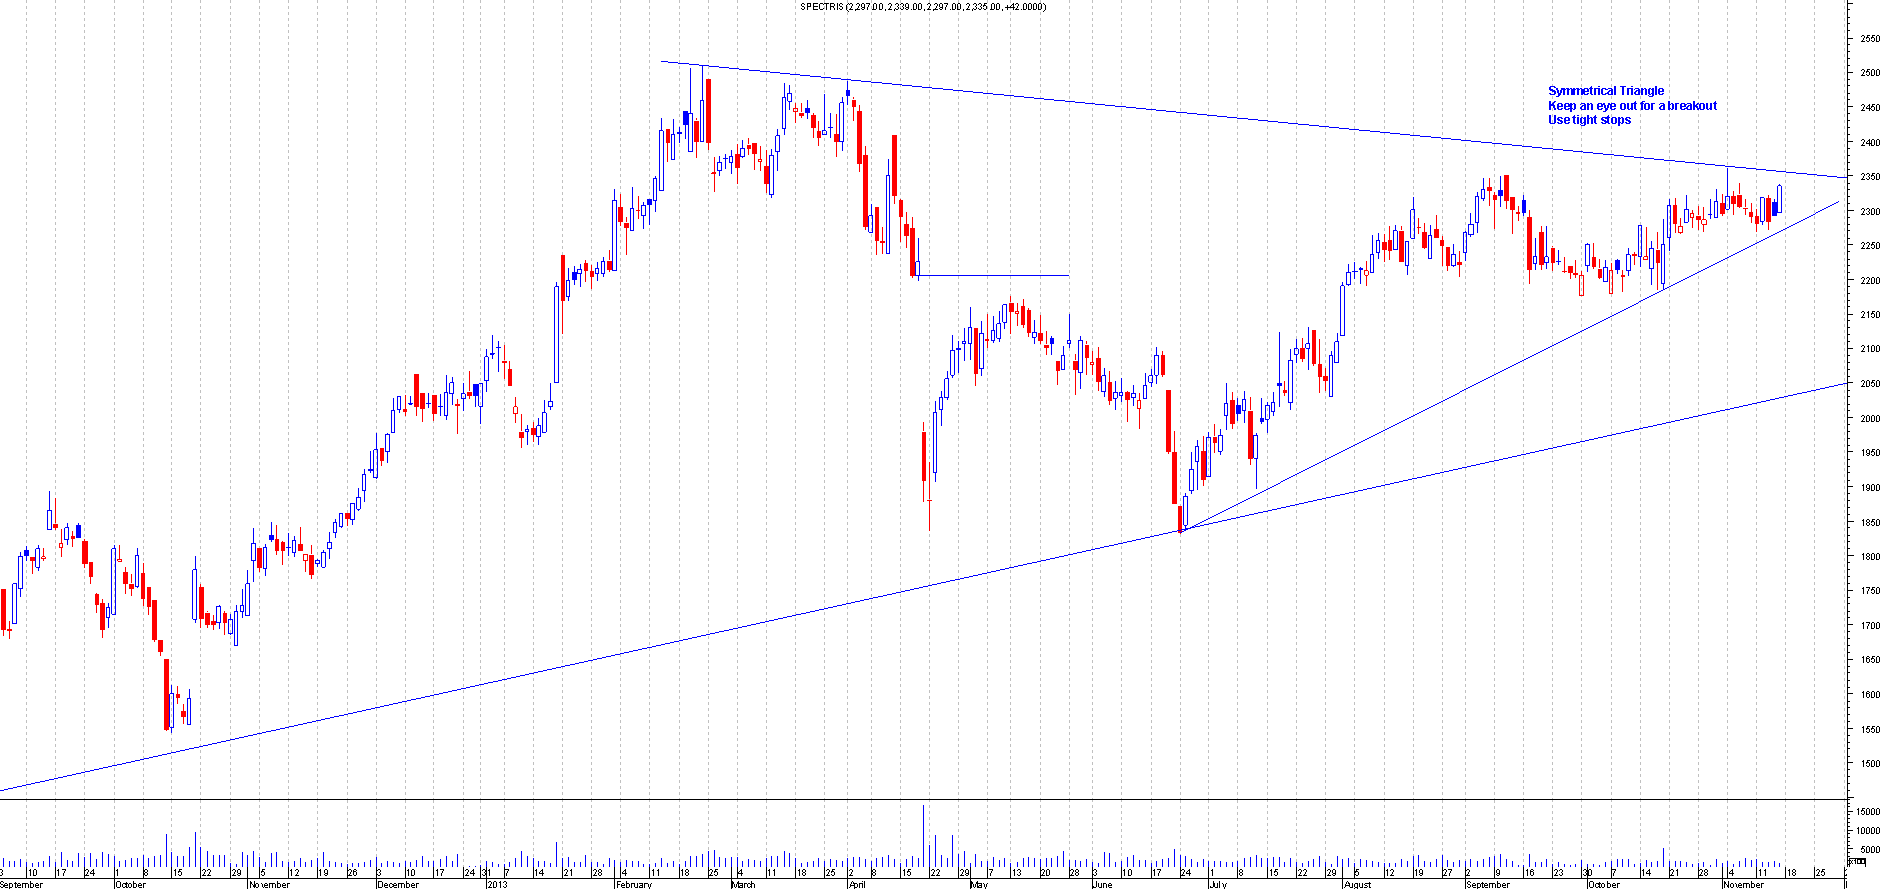
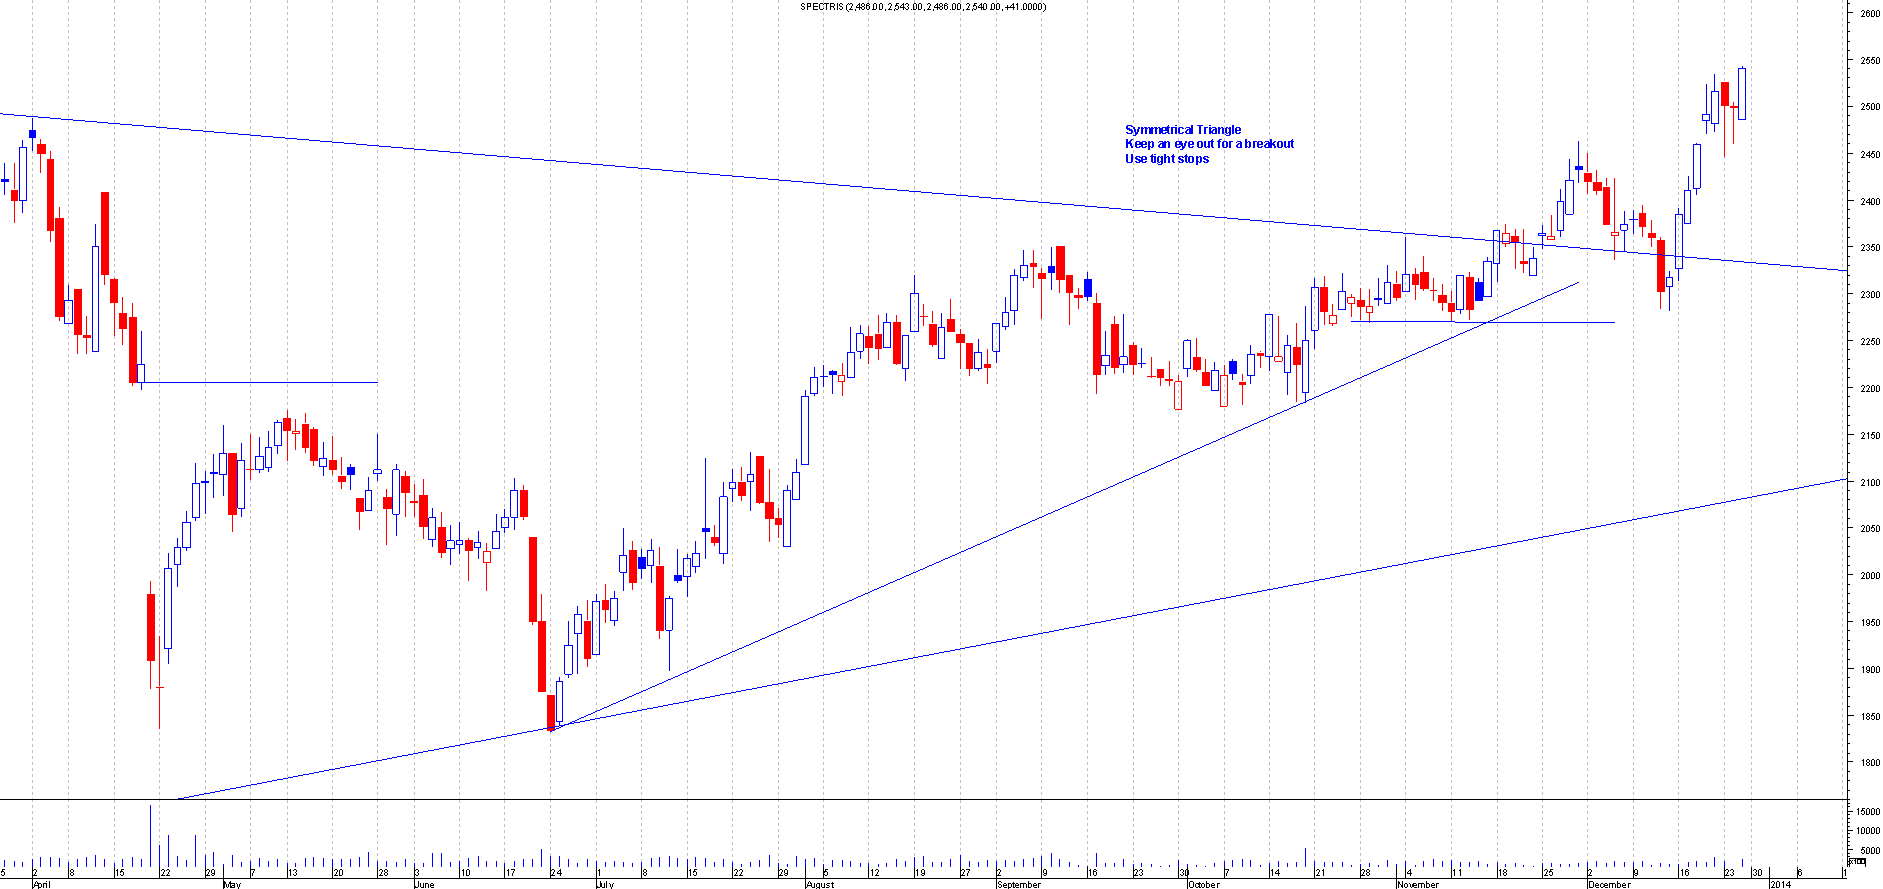
Before: This is the Chart of Spectris when I first mentioned this:
After : This broke out of the symmetrical triangle and netted over 200 points.
25th November - 1st December
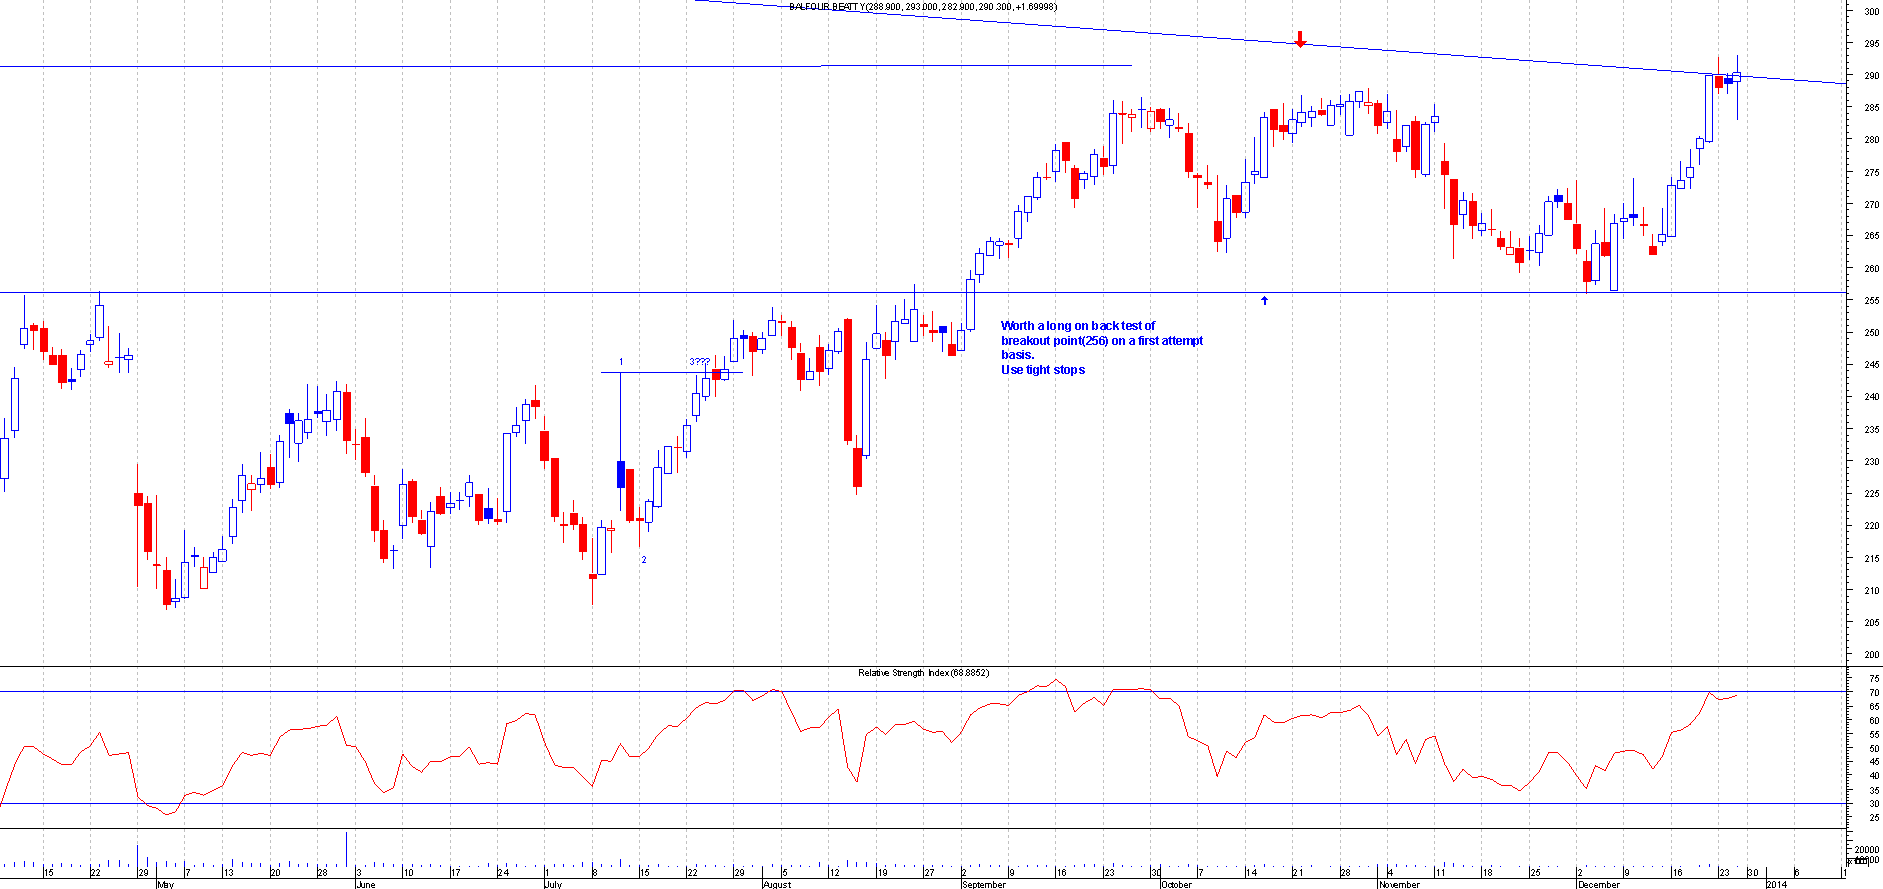
BALF.L
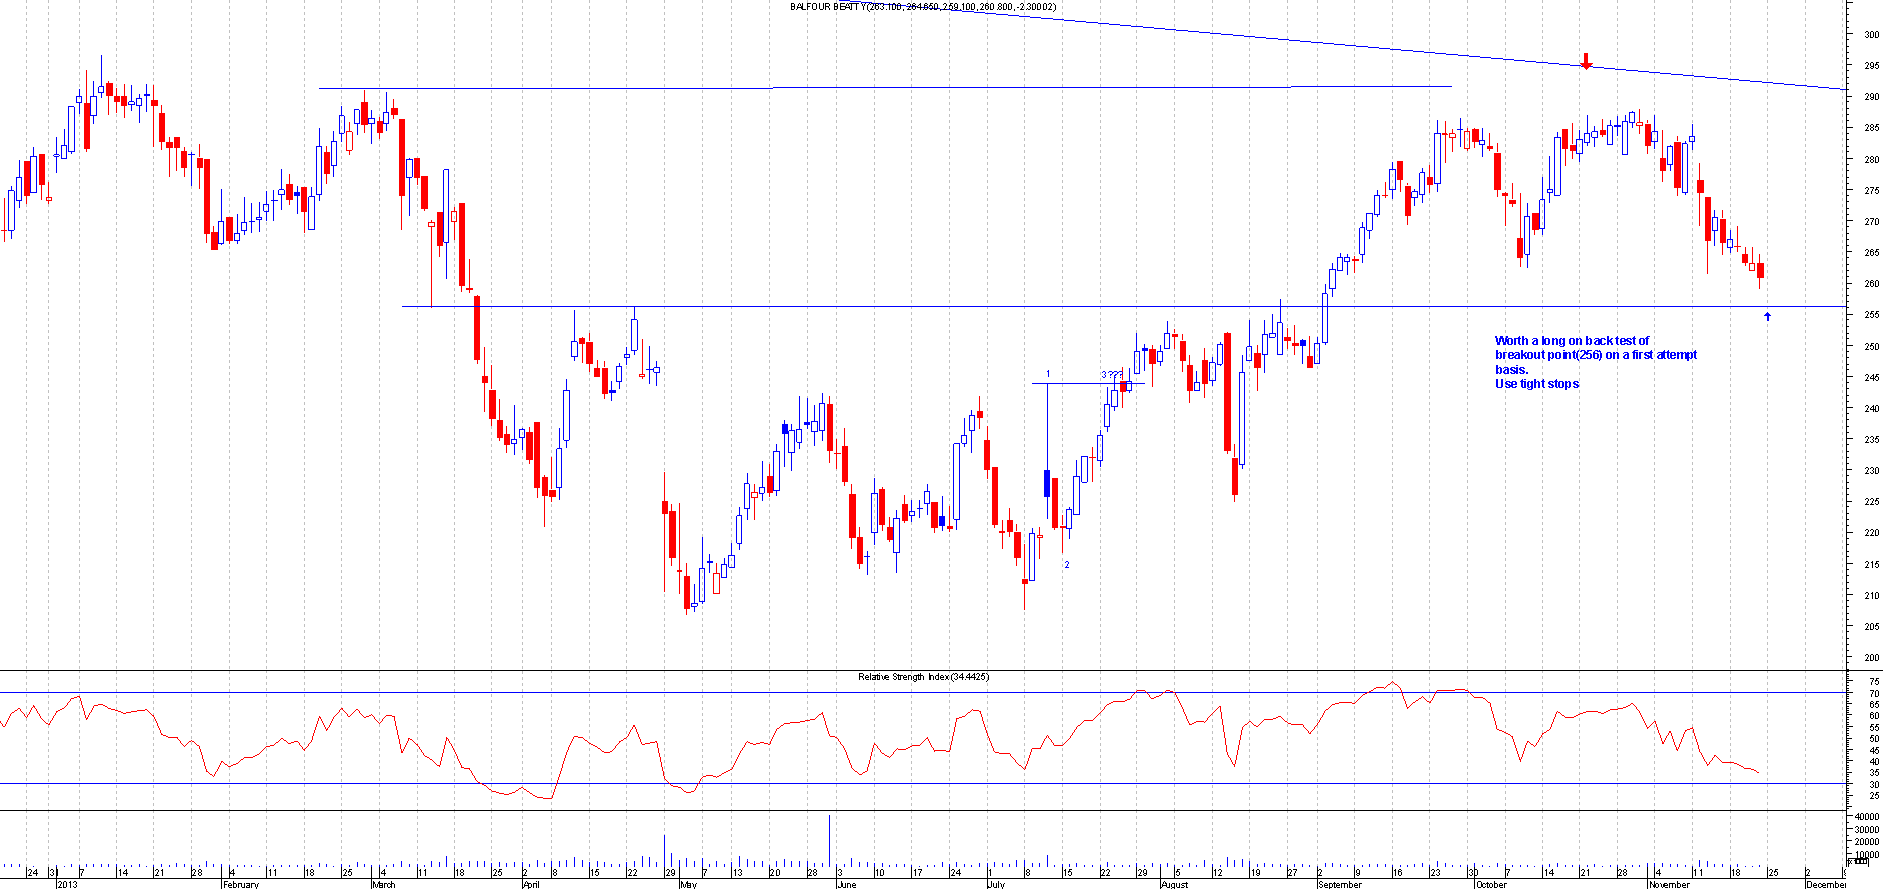
Before: This is the Chart of Balfour Beatty when I first mentioned this:
After : This bounced of nicely from the back test and has since moved over 35 points
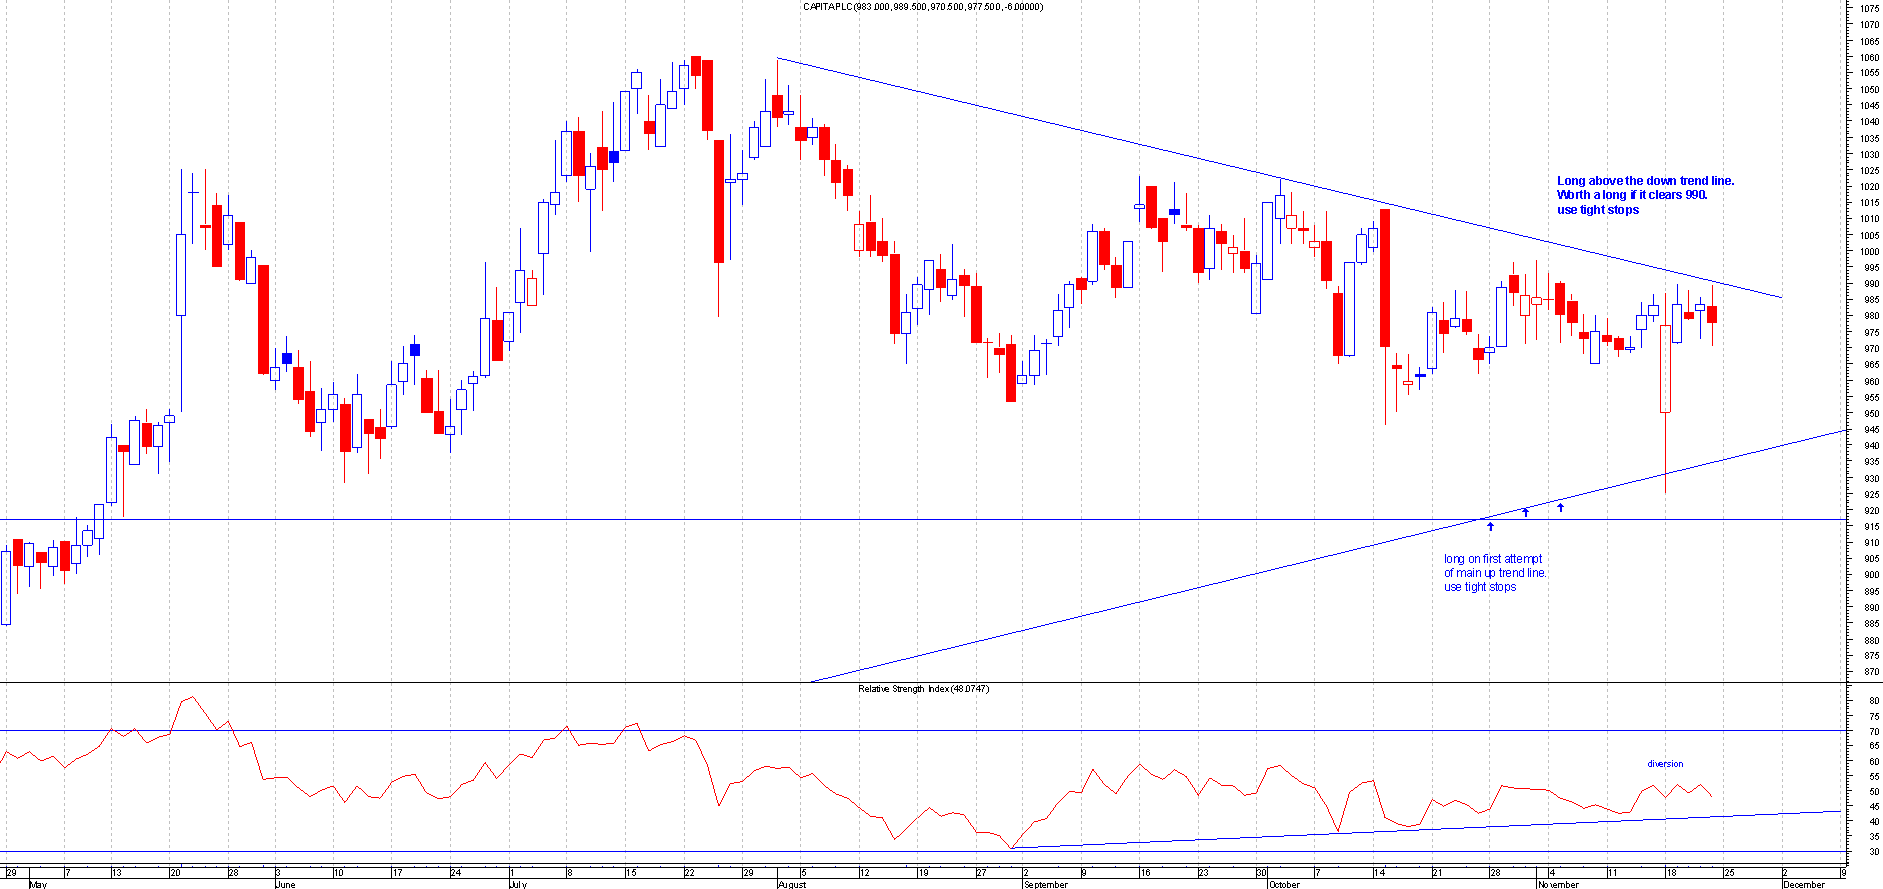
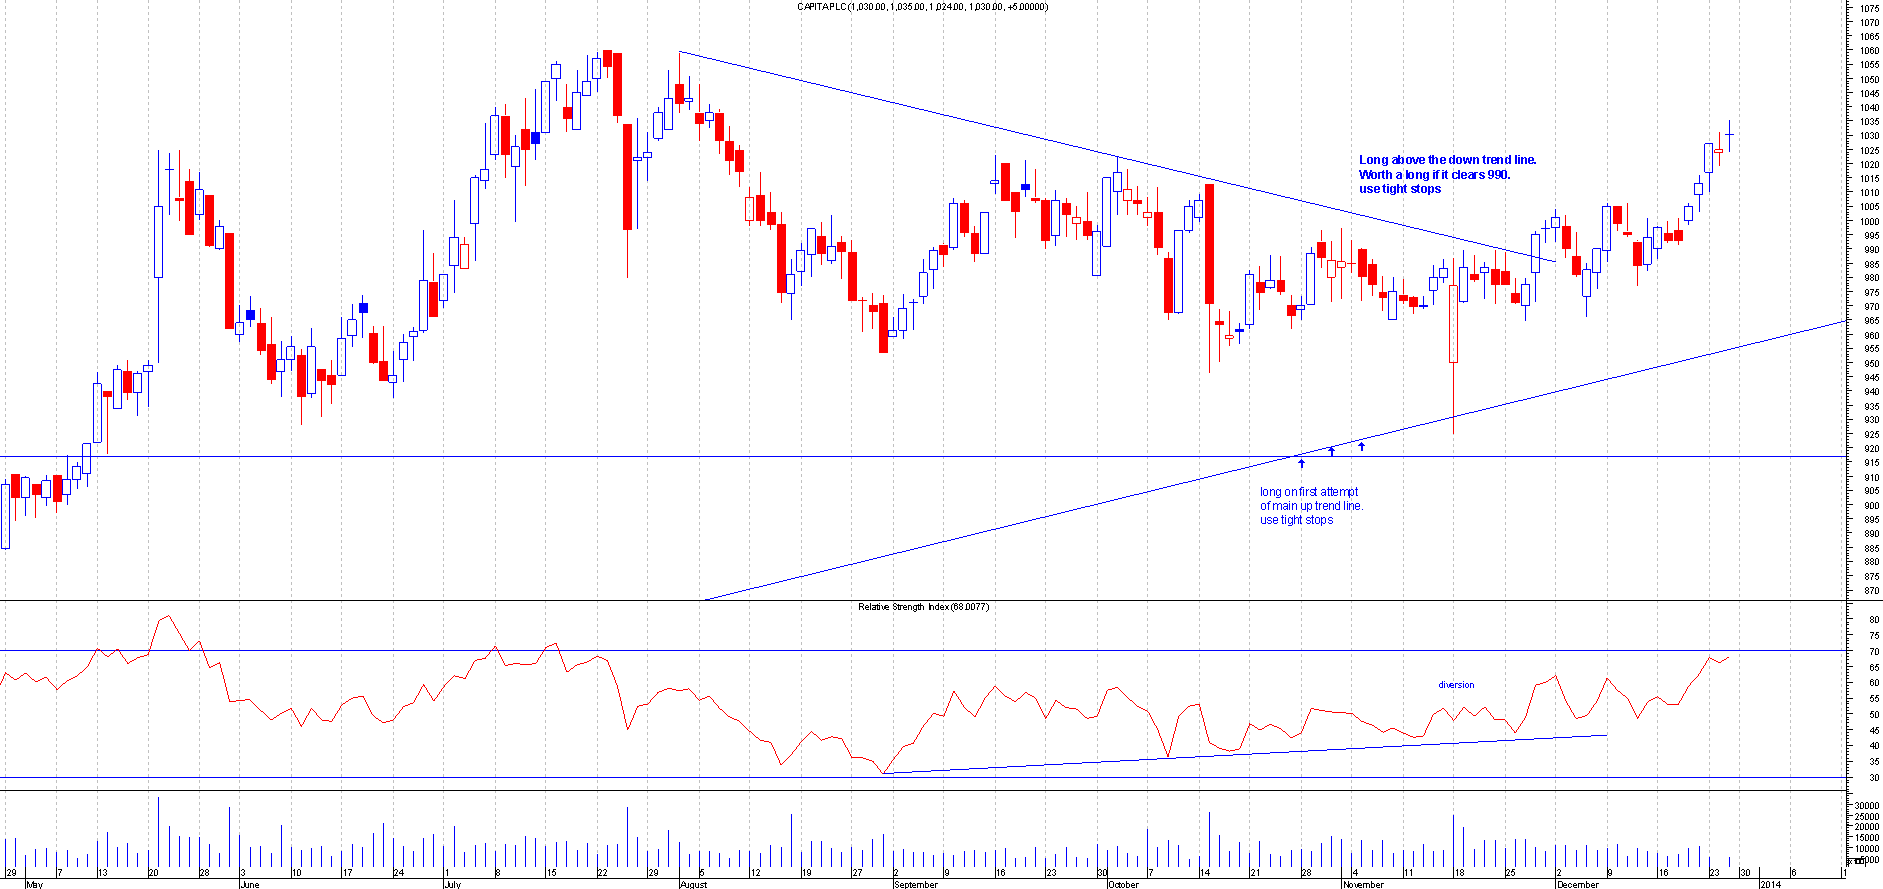
CPI.L
Before: This is the Chart of Capita PLC when I first mentioned this:
After : This broke out of the short term down trend line and moved up slowly. Moved over 40 points.
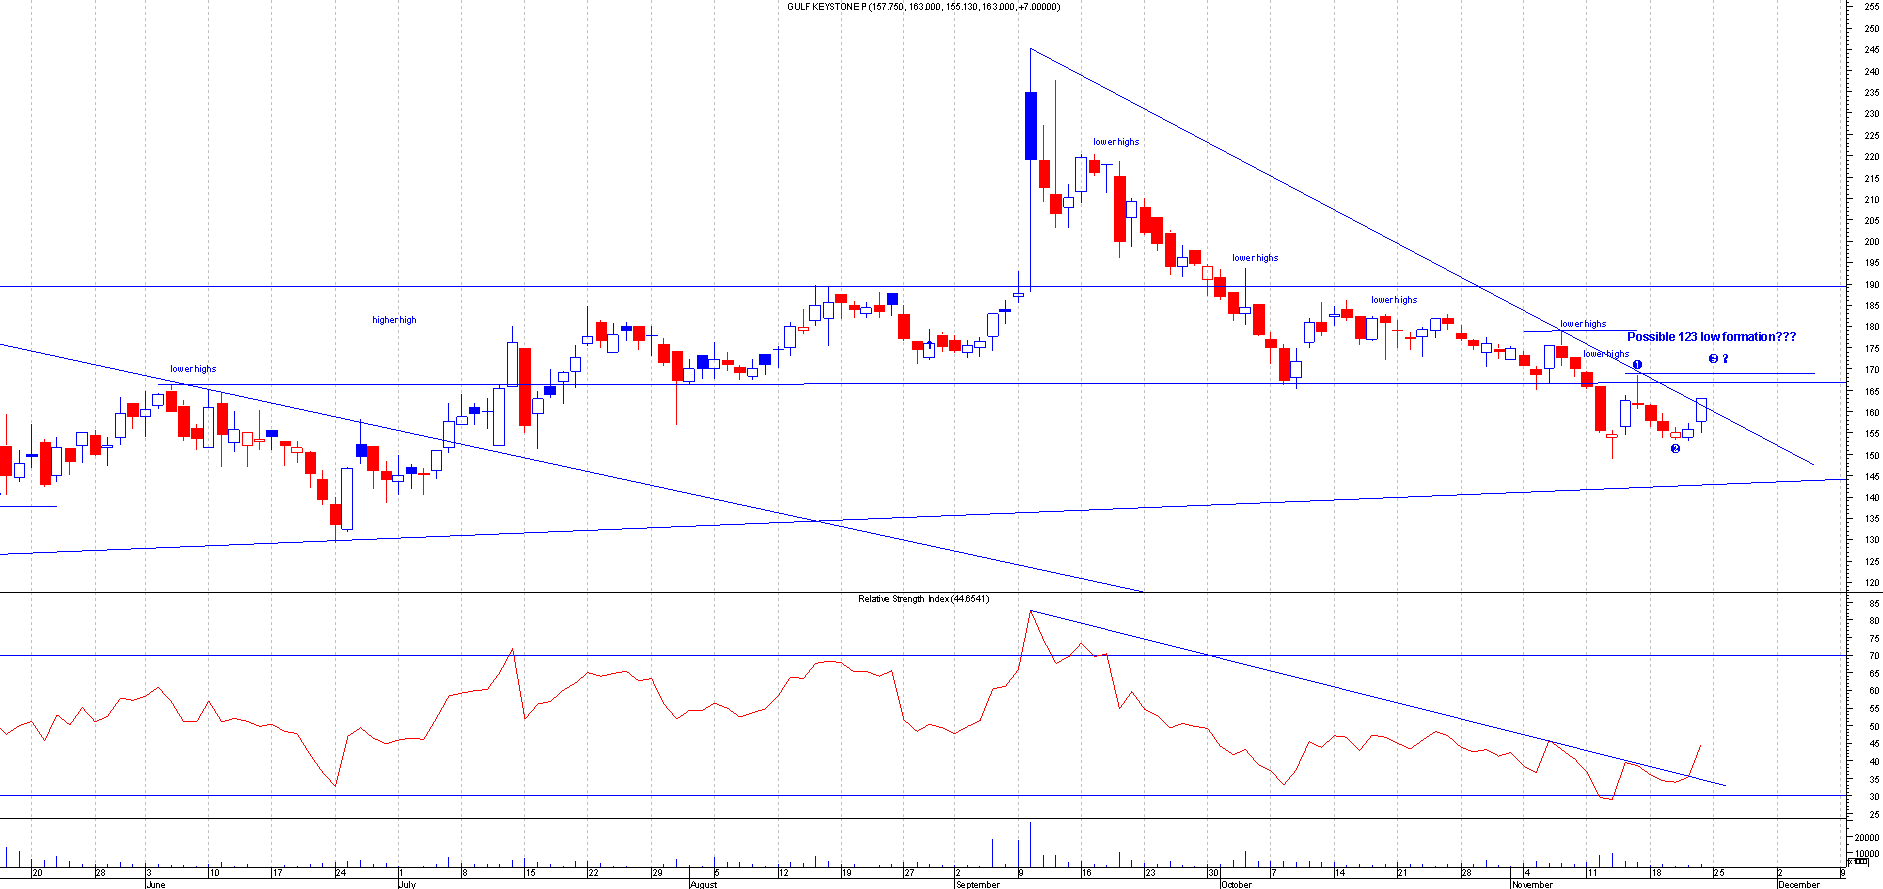
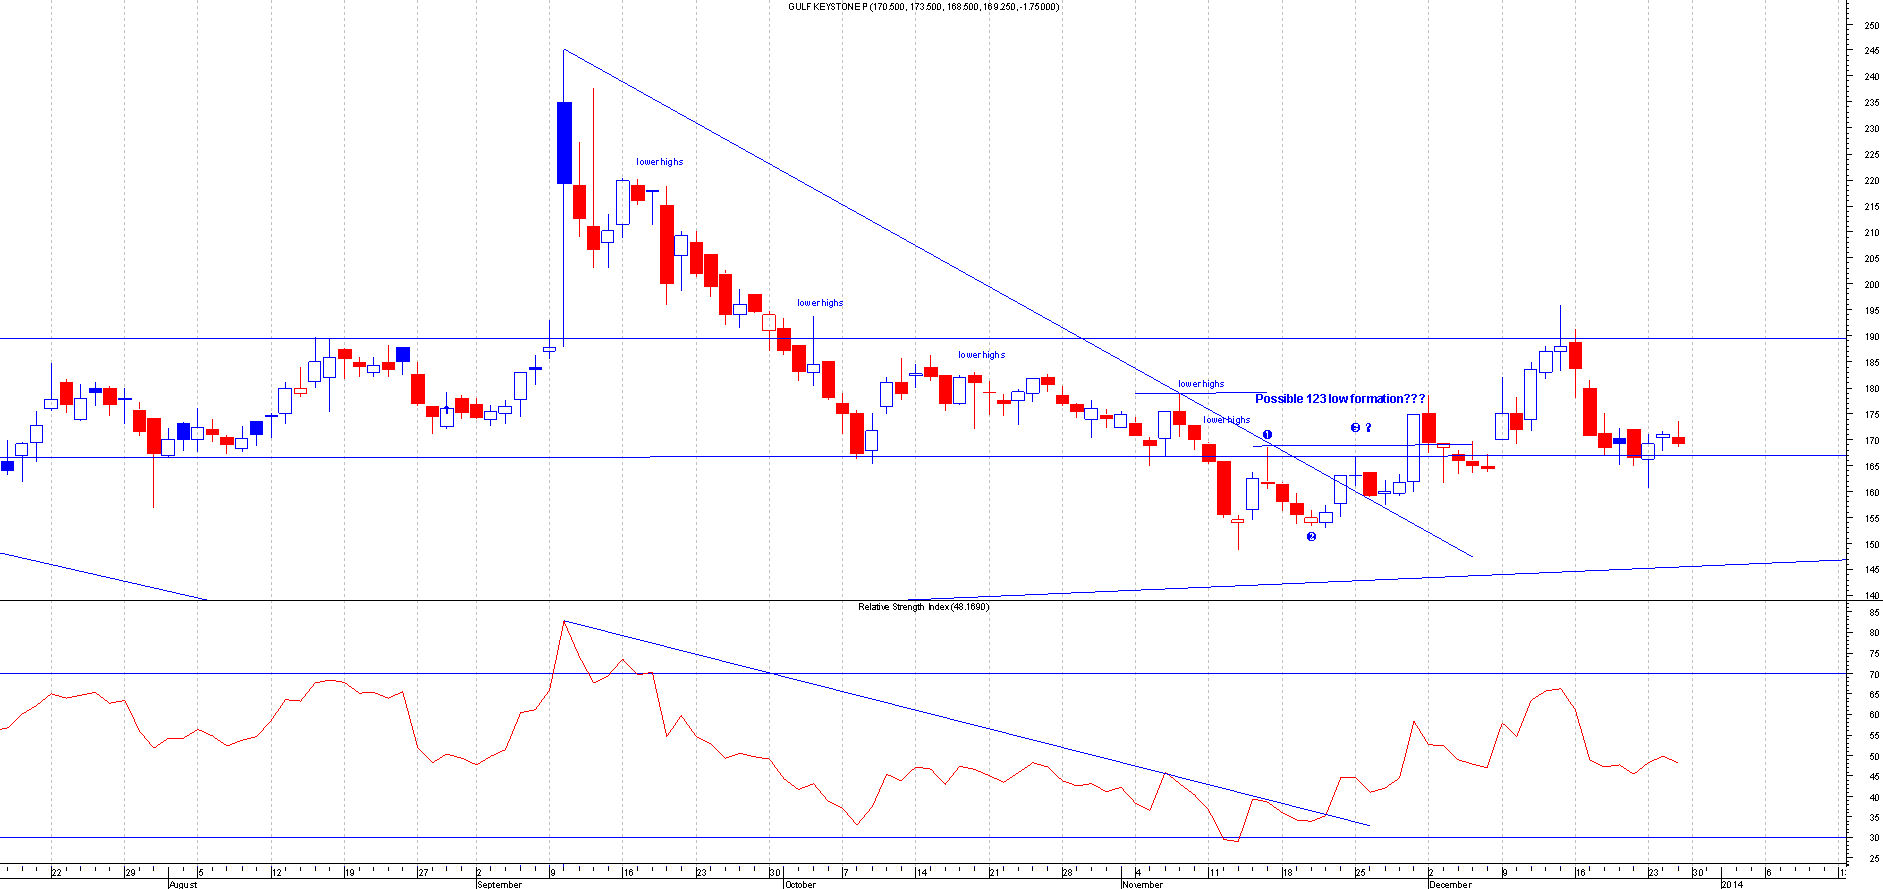
GKP.L
Before: This is the Chart of Gulf Keystone when I first mentioned this:
After : This broke out of the 123 low and has moved over 25 points.
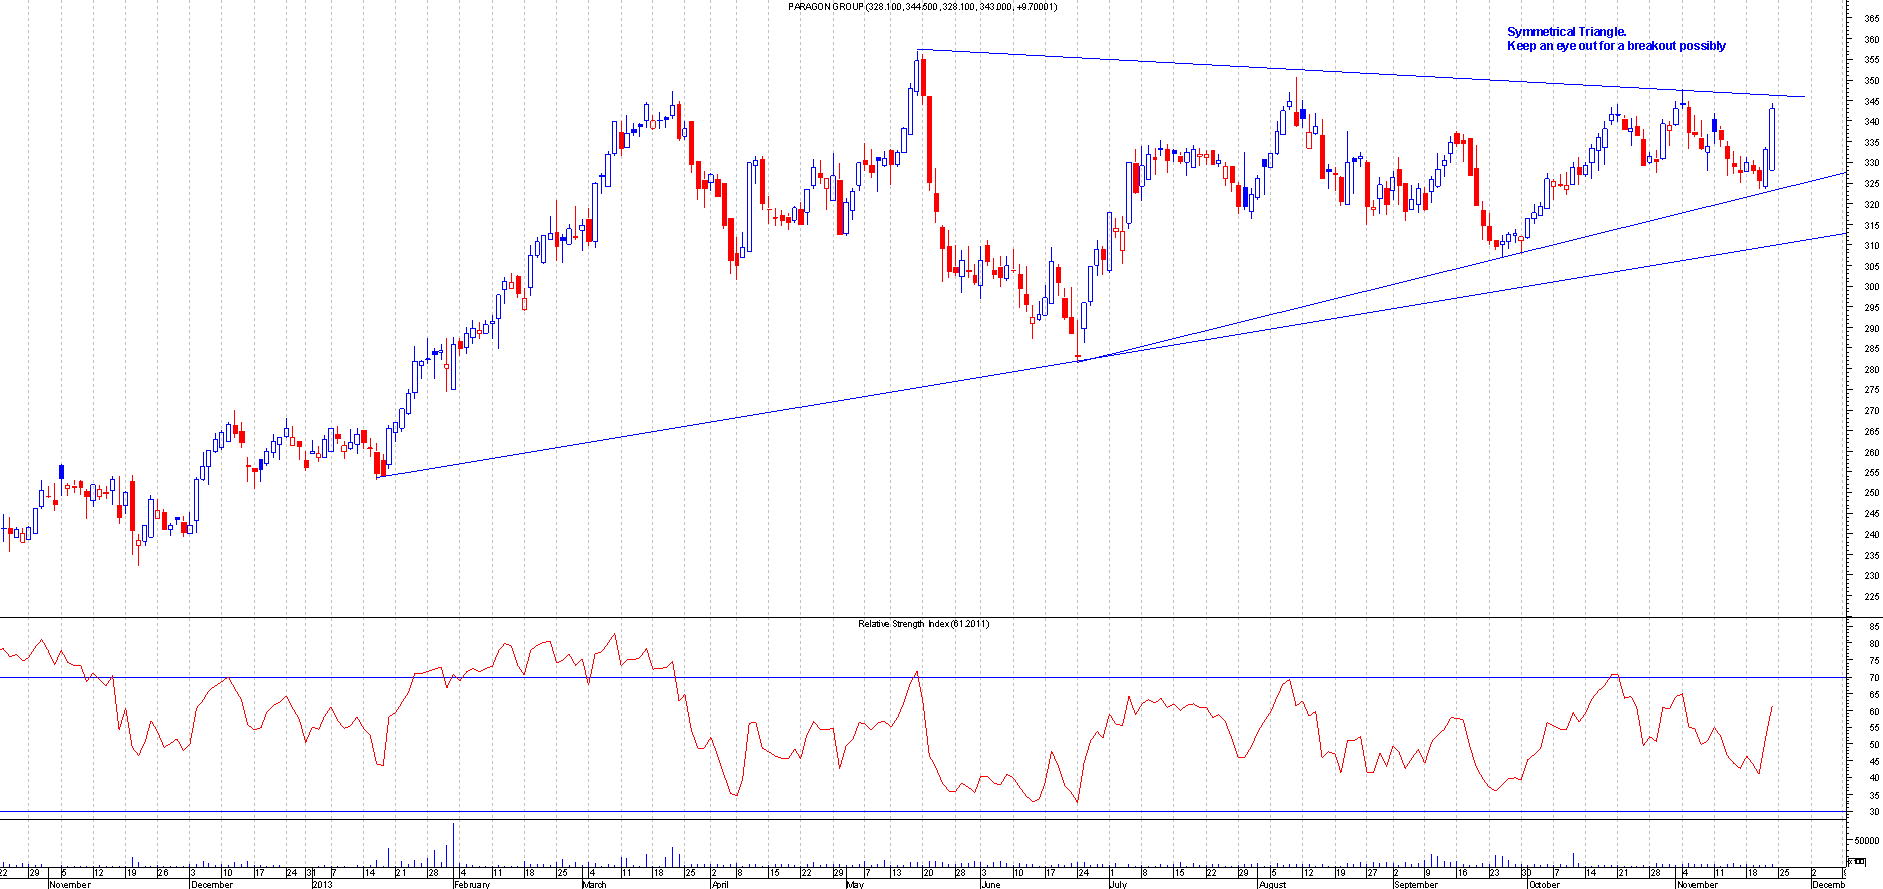
PARA.L
Before: This is the Chart of Paragon Group when I first mentioned this:
After: This broke out of the symmetrical triangle and has moved over 25 points
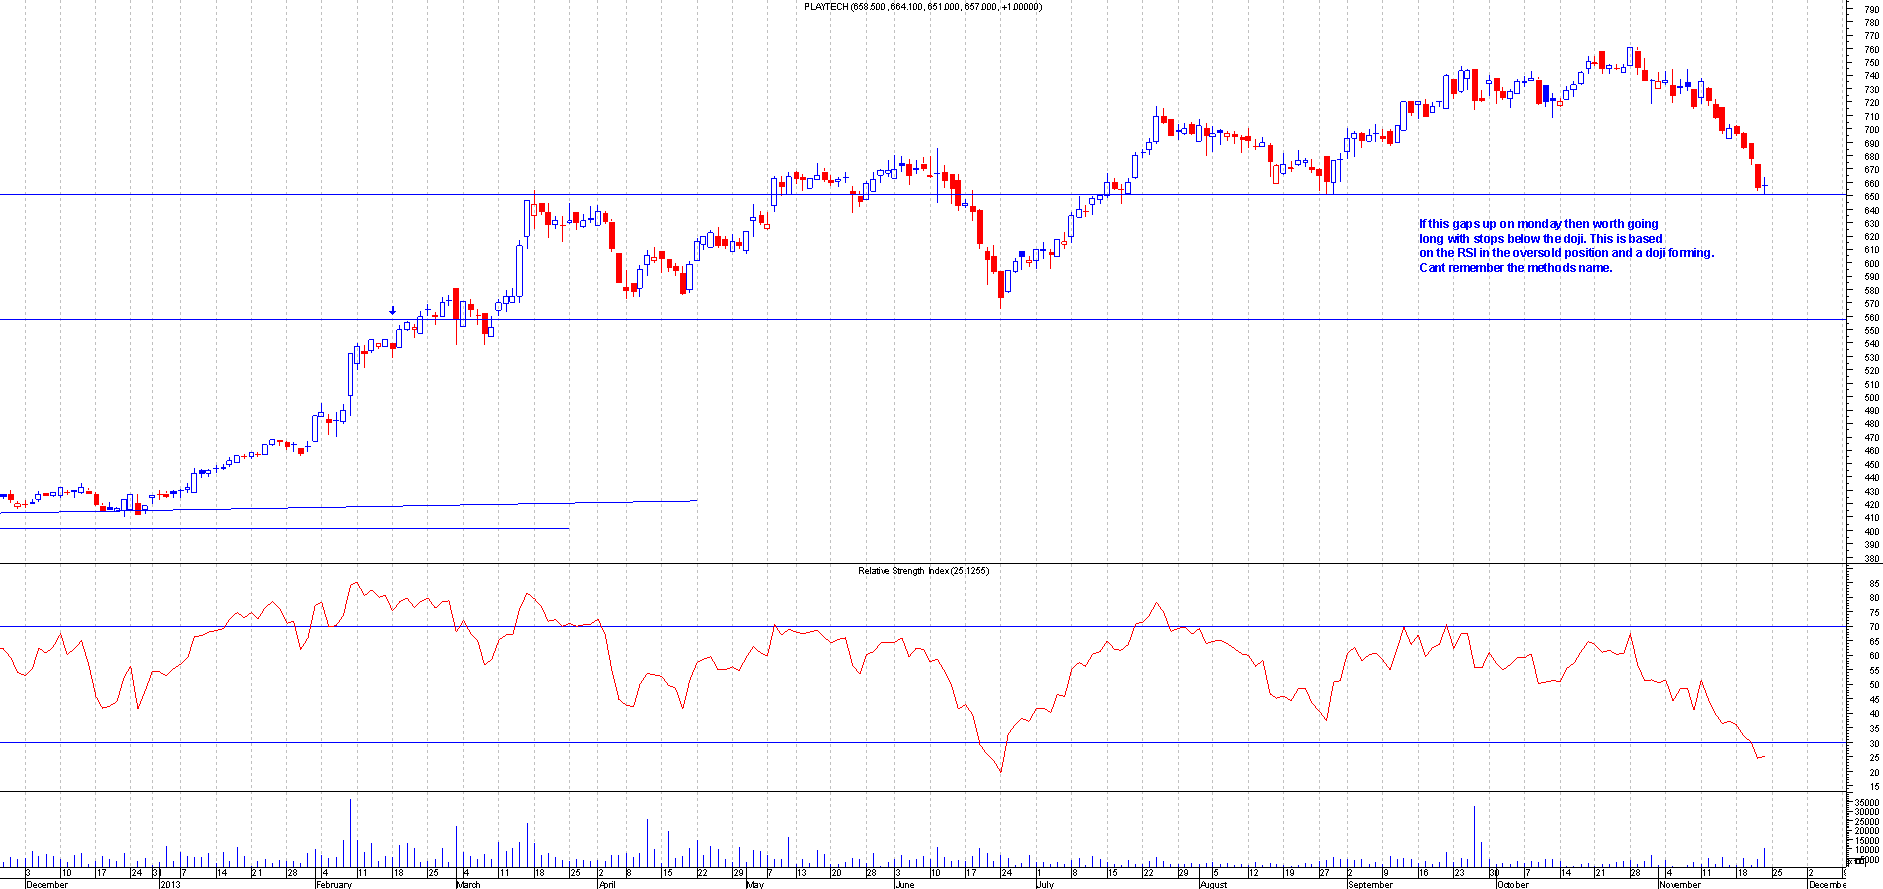
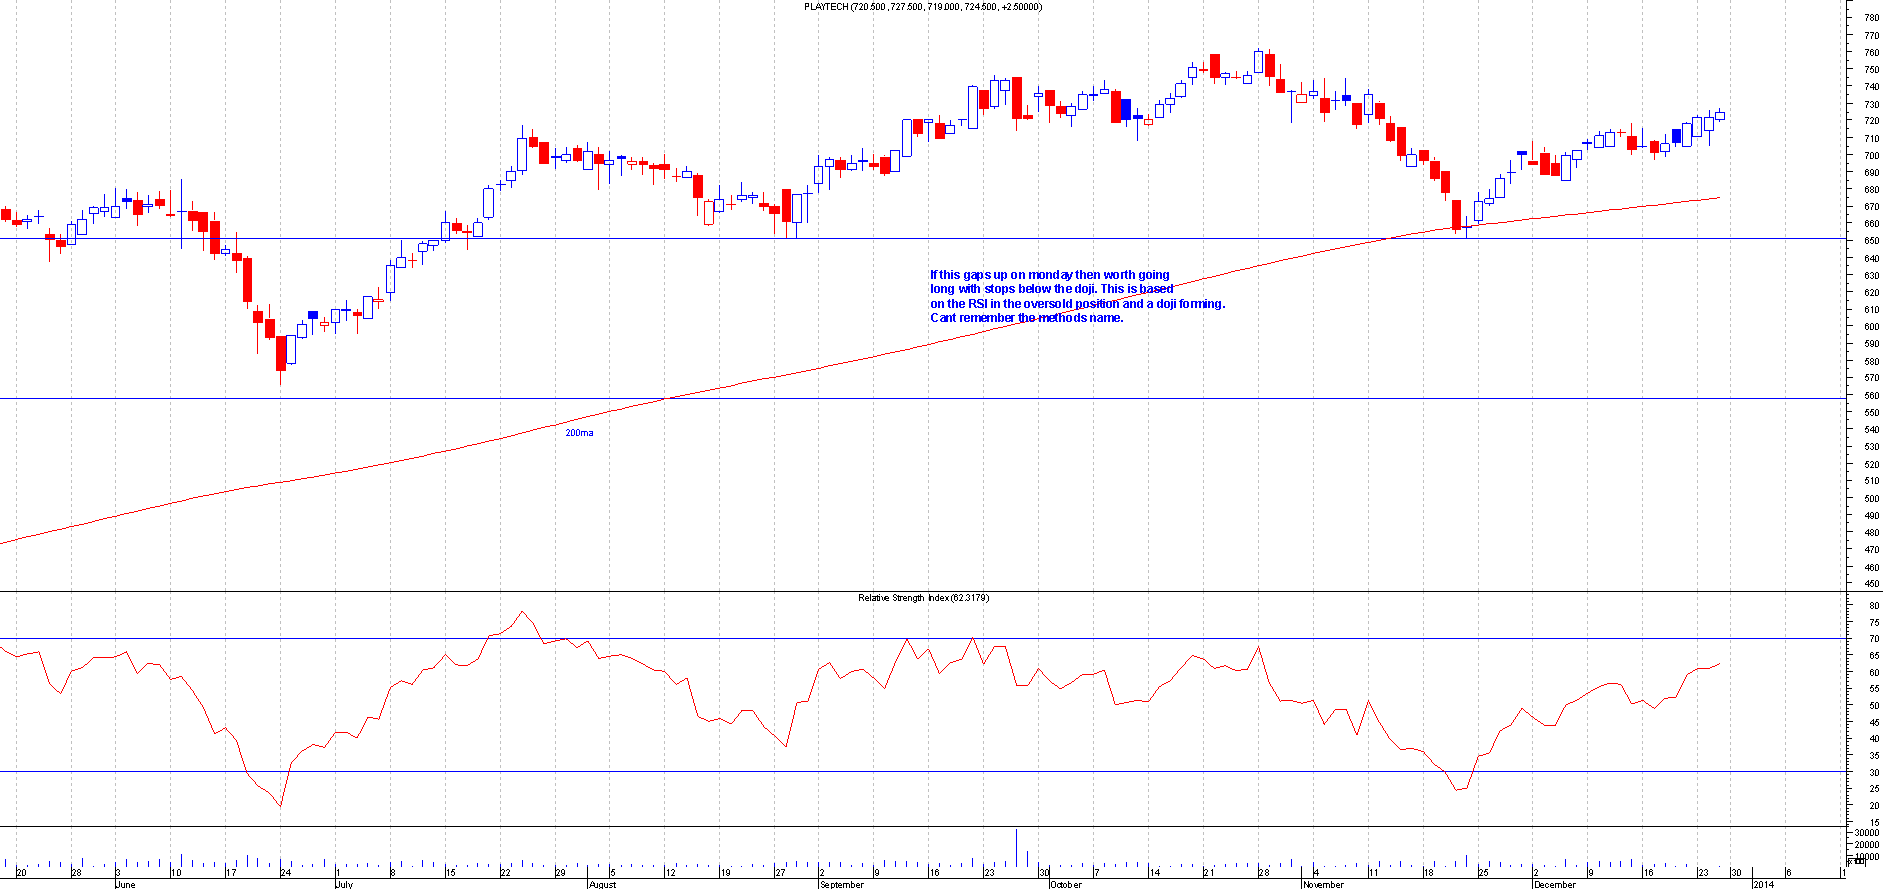
PTEC.L
Before: This is the Chart of Playtech when I first mentioned this:
After : This gapped up as predicted and moved over 65 points.
RIO.L
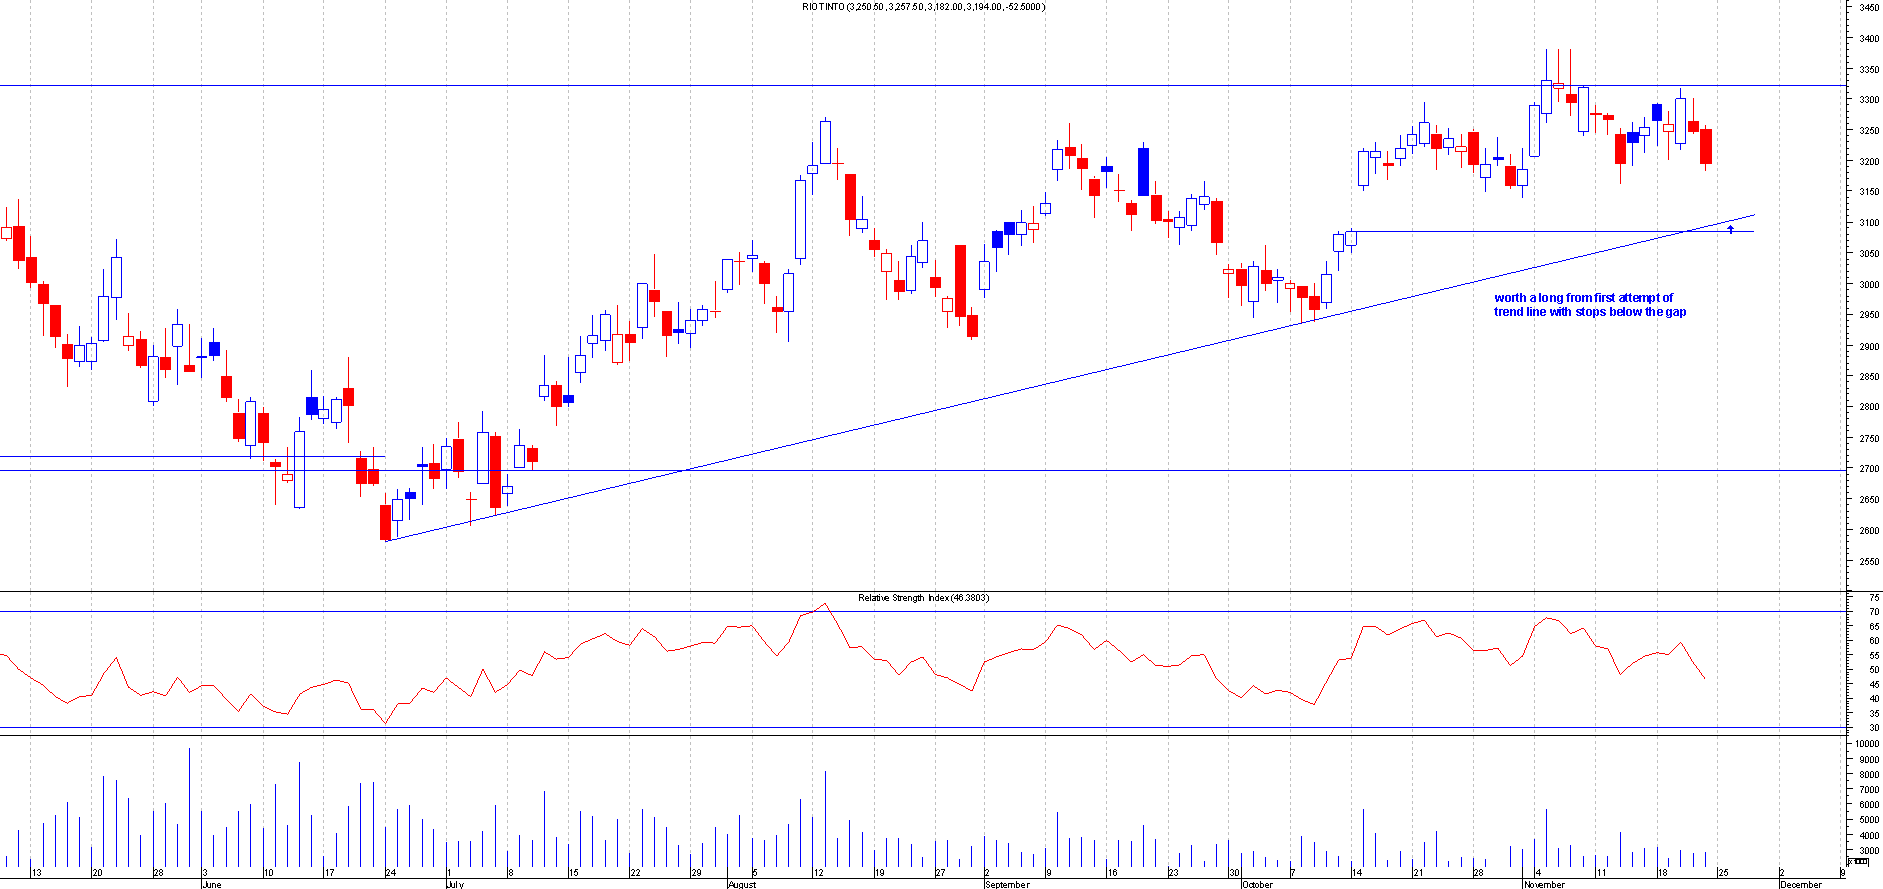
Before: This is the Chart of Rio Tinto when I first mentioned this:
After : This bounced of the trend line perfectly and has moved over 280+ points.
TLPR.L
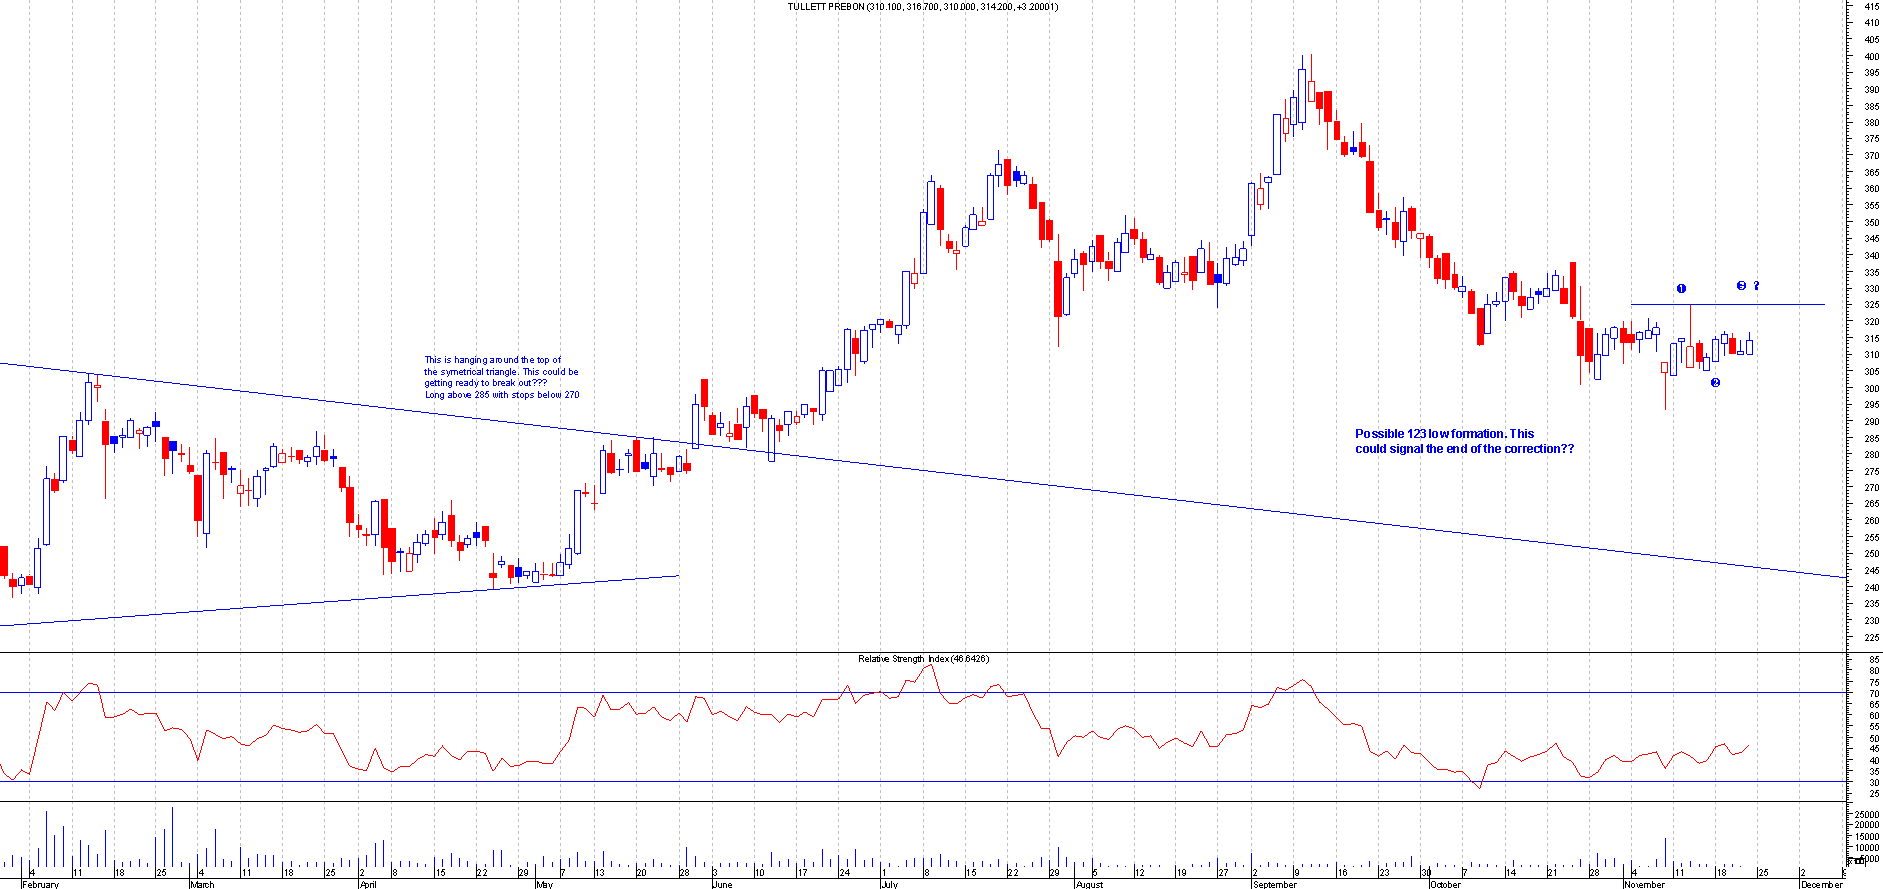
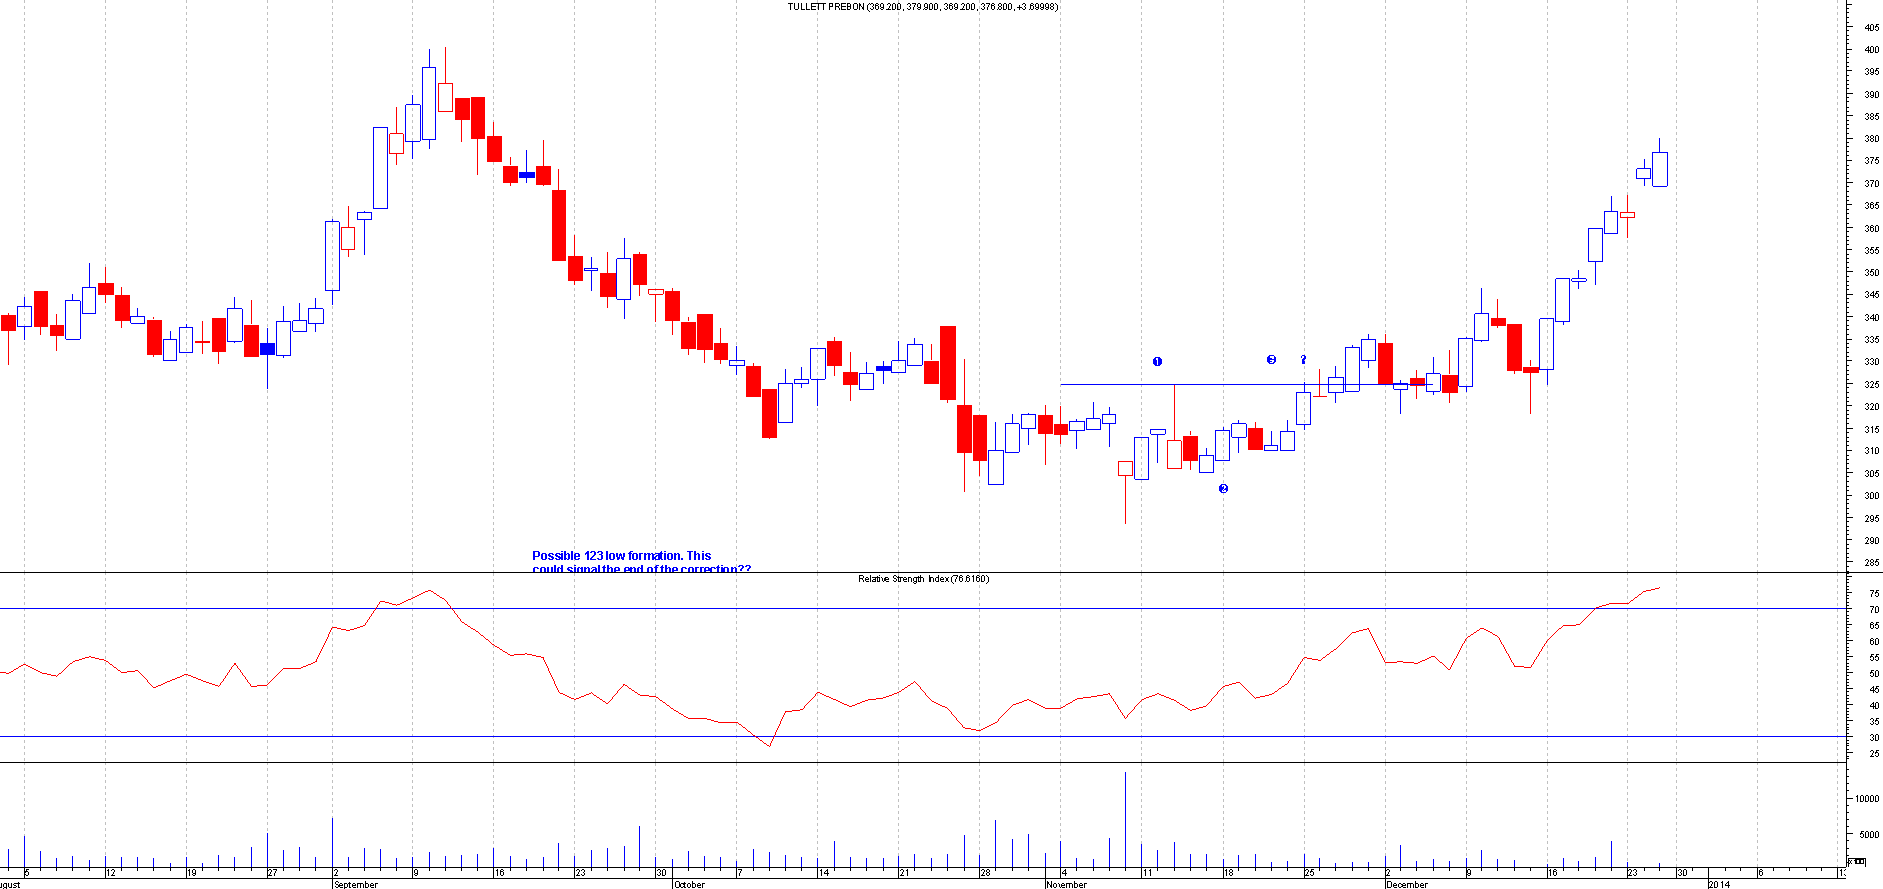
Before: This is the Chart of Tullett Prebon when I first mentioned this:
After : This broke out of the 123 low pattern and signalled the end of the correction. This is currently up 50+ points.
That concludes the long blog for the whole of November. As can be seen there was a lot of good trades in November and it was another hefty month for gains as i netted over 2000 points. Im still in most of them with free trades so more profits hopefully to come as we have a bit more to go with the markets.
Hope the blog was understandable as i have done it so its easy to read and understand.
Im falling behind with the blogs as have been very busy with the trading. I still have to do Decembers blog yet....
so keep an eye out.
Here is the links to previous blogs so you can see how well they have done.
ShareTips from 21st October-3rd November
Share Tips from 2nd September - 20th October 2013
Share tips from 28th May - 2nd September Part 3
Share tips from 28th May - 2nd September Part 2
Share tips from 28th May - 2nd September Part 1
The tips section is available only to members and as membership is only £39.95 for the year what are you waiting for.
See you on the forums
remo









Brilliant website you run Remo, many thanks for all of the heads up you post allowing members to hone their skills and narrow the search for possible upcoming trades. All the best for 2014!