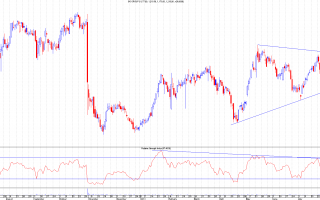
Well, sell/short signals don't come much easier than yesterday's and today provided confirmation of the top at 166p, just 1p above the target.The short term uptrend channel provided support at close, but another bearish day tomorrow will give a hat-trick of bear candle patterns: bearish engulfing, three outside down and then three black crows. We'll have to wait and see on the latter (they're not common) but the top of the rise seems clear for now. Really classic trading today and easy money if you could get the position. Original link...
Continue reading
Just a quick update as there's not really a lot to add here. The RSI broke down through the support formed from the 126p low bullish divergence and that confirms the end of the rise to me.Note also how the price high came not at the first bearish divergence, but at the second one. That is quite a common feature of RSI. It can't be 100% relied upon but is does happen often. Original link...
Continue reading
Following on from yesterday's post on the Dow Jones, we can see the impact of a trendline break at the close of play.I've zoomed in here so we can see a close up of those (brown) Fibs showing the possible retracement levels of what I've labelled as a wave 3 up from the 31st Dec low at 12884. Yesterday's low came close to hitting the 23.6% Fib which is the level I'd expect for a wave A of a correction ultimately to the 38.2% Fib which would be about right for a wave 4.In the comments from the previous entry, Gary has highlighted the 161.8% extension of the initial drop (these are the blue Fibs) at 14934 as a possible low for this element of the correction and that coincides very nicely with the 23.6% Fib at 14921. There's also support from a previous breakout level at 14887 nearby so...
Continue reading
My orders to go long got triggered out of hours yesterday but had wide-ish stops so they didn't get taken.I've already closed half and moved my stop to just below the 6410 low on the cash chart. Can't be too careful with the indices! Original link...
Continue reading
Here's GKP's dily chart from yesterday's close. It clearly shows a bearish engulfing candle which could form part of the three outside down patter mentioned by Gary in the last comments.Note how this occurred at a confluence of resistances: the old downtrend from 228p, the bearish wedge resistances and the 38.2% Fib of the 228-126p move.In addition, the RSI also found resistance at double bearish momentum discrepancy reversal points (this is where RSI makes higher highs but price makes lower highs during downtrends - these are usually continuation patterns).Remember, all these bearish patterns have occurred just at the area we've been discussing. They can't be relied upon 100% bit it will take a close above 166p for higher prices now and a close below 160p today will confirm the downside move. The question is: would that be a retracement of an impulse move or would it be wave 5 of...
Continue reading


