FTSE formed a perfect hammer at the key support of 6216 today and could signal the start of the next wave up. The only caveat to add is that the drop from recent highs looks a lot like a 5 wave move to me so it's possible that this is just a correction upwards in the downtrend. Original link...
Continue reading
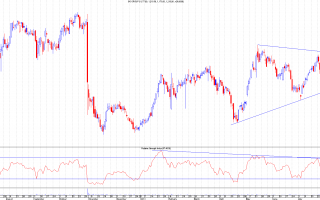
There's a possible downtrend breakout and 123-low coming in HOIL. I will be looking for the daily RSI to break it's trendline on a closing basis BEFORE price prices through its downtrend resistance.Even if that happens I'll be cautious until 161p gets taken out on a closing basis as that's another key resistance. If it can get past that then we'll have a trendline break and a 123-low breakout which could bode well for higher prices.One to watch for sure. Original link...
Continue reading
POG is back at the short term channel support so I'm long again on this but with a tight stop just below the recent low of 128.2p. I have concerns about this trade but the stop position is good so it offers a good risk/reward if it plays out.My concerns are due to it's bear flag appearance (as highlighted by Gary in previous comments) and it's failure to reach the target and hold a 123-low breakout on two occasions. If it breaks down and my stop gets hit I may even reverse position and go short but I'll decide that later. Original link...
Continue reading
There's probably a lot of excitement on the bulletin boards after today with a lot of people calling for upward price movement and a break of 166p from here so I'll start with the 4 hour chart that will be causing that. There's more to add though so this might be a lengthy post.We can clearly see a big hammer candle with bullish divergences apparently forming in RSI, MACD (not quite a proper one) and we also had Gary's chart in the previous comments showing a divergence in MFI (Money Flow Index) and how today's low fits with his harmonics and Fibs.The 147p low was also very close to the 50% Fib of the rise from 126p to 166p which is at 146p some that might add to the idea that the retrace has done enough. There is another view though and it's one I favour. First, the daily chart....
Continue reading
Here's XEL's hourly chart going back to the RSI low which formed the bullish divergence at 88.75p a few days later.We can see that the trendline was confirmed later with a further bounce which pushed the SP up to the 112.5p area forming a bearish divergence (you can see the lower high in RSI at the higher high in price). This bearish divergence resulted in the break of the RSI uptrend, followed by a retest (which actually broke back above, briefly) and a rejection. One obvious aspect of this chart is the big gap up from 92.5p so I'd suggest it's at least likely to fill that. There are a few possibilities here actually which is why I'm staying sidelined. I might be tempted to go long at that gap Original link...
Continue reading


