


GKP 4-hourly 07/06/13
in ChartsView Blog:- Font size: Larger Smaller
- Hits: 5549
- 0 Comments
- Subscribe to this entry
- Bookmark

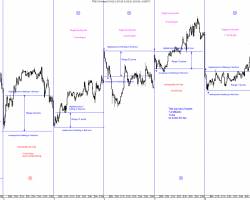
I've chosen to use a 4 hour chart here as it fits all the features in nicely. The factors to note are:
The trendline from the last few days has broken down. Price gapped up on open to that trendline and dropped straight off it;
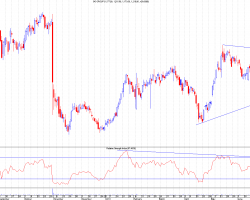
The RSI trendline from the bullish divergence is providing support and this coincides with the 38.2% Fib. This could signal that this is indeed a correction rather than a final wave down but it's early days yet;
The Fib levels to watch are at the 50% and 61.8% levels. These are 146p and 141.5p respectively (note that the 61.8% level also coincides with the low of the drop off 159.5p and was also a key level providing the initial bounce point from the drop off 450p).
I would expect that RSI trendline to break as that's what should happen for a wave 2 and it would go in the event of this being a final wave 5 of C down too so I'll not read too much into that. I think it's worth buying the 141/3p level but with stops just below the original breakout point of 137.5p (the next support down) so that's my current plan. As ever, though, it's subject to change in the event
Trackback URL for this blog entry.