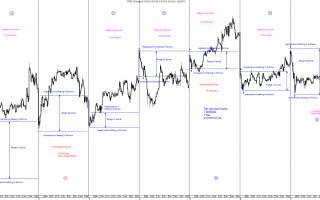
Following on from the comments on the last post, I thought it would be a good idea to have a reminder of the 2 main wave options going forward. Most of the recent discussion has focused on short term, small-ish price movement possibilities so some context might be good.I've done both of these charts in log scale which shows percentage change rather than pure price change. This is so that we can see the relative size of waves of same and varying degree.The first chart above shows the possibility of the whole post-203p move as being a running flat. These are rare and feature a wave B which ends substantially above the starting point of wave A and C ends above the end of A. They occur in exceptionally strong trends but even then there are very few examples of them.The far more common type of flat correction where wave...
Continue reading
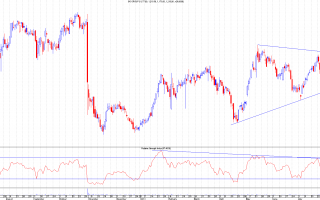
On Friday I wrote a piece on www.chartsview.co.uk illustrating the two main possibilities for SLE now it appears to have bounced off the gap up from a few weeks ago.Here we have the bullish option where we've just had the end of a wave 2 (ie a higher low). This should result in a move up towards the recent 8.5p high (in 5 mini sub-waves) followed by a 50-60% retrace and then a breakout to new highs substantially above 8.5p. I've actually started to doubt this option due the the wedge shape on the last rise (a bear pennant), the fact that it's dropped back below the old downtrend resistance (causing a false breakout) and the apparent 5 wave move down from 8.5p to Thursday's low. The bearish option is as follows: In this case SLE ought to be due a bounce anyway after forming a 5 wave pattern down....
Continue reading
OPHR went a bit lower on an intraday basis than I anticipated but is closed above the channel support two days running after testing it and then gapped up in Friday.The main RSI trendline came into play again too so this looks good for a test of the immediate resistances at 375p and then 414p. Original link...
Continue reading
Thursday's hammer at a key support level was confirmed on Friday by the upward move and the test of the previous support.It does need to close above this 68/69p level to make me feel more comfortable that further gains should follow though so I've still got my stops just below the hammer low of 63p as it could just have been backtesting the breakdown on Friday. Original link...
Continue reading
I'm going to continue to use this 4 hour chart until it stops being useful as a way to see what's going on just because it has twice as much detail as the daily chart and we're looking at relatively short term moves.I've put on here a possible count for this move down from 166p. I've labelled the count based on EWT rules allowing for crossovers and wave patterns. Having done this, it then seems to look more like a corrective wave than anything else. That would make it part of a wave 2 down rather than the wave 5 of C previously discussed. If so, then we ought to be in the final sequence of that (which would be wave c of 2 and should have 5 mini subwaves within it) and it points, again, towards that target area of 137-141p. There could be alternatives to this so I'm...
Continue reading


