I missed the chance to go short on this at the descending triangle resistance shown here on this 4 hour chart. There should be another chance on a break of 1388.9p so I may look to go short on a backtest of that if it happens.Gold can be very volatile so stops are a must. Be very careful if you're thinking of trading this commodity. Original link...
Continue reading
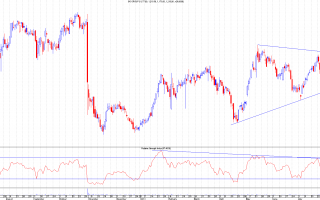
I took this chart screenshot during the day yesterday as it hit that upper RSI support and price support at 872 both at the same time and bounced perfectly forming a hammer by close of day.It always worth looking out for RSI supports and price supports coinciding like this. Original link...
Continue reading
The Dow found support at the intermediate uptrend channel last night but if this wave count is correct then it ought to break through that trendline towards the 38.2% Fib level at around 14534.As long as the trendline holds then higher price could follow.Note the support from the subwave 4 low at 14444 - that should not get broken by this correction even if the channel gets broken. Original link...
Continue reading
The FTSE 100 could be headed towards the trendline up from Nov lows which is at 6412 where there is additional price support.I'm not sure if this area will ultimately hold if the Dow drops to the 14534 area, but it should be good to go long here with tight-ish stops for a day trade. This trendline level will rise slightly each day. Original link...
Continue reading
LLOY formed another inside bar yesterday. The normal way to trade these is to go short on a break of the low with a stop above the high of the covering bar (61.89p and 63.02p in this case) or long on a break above the high with a stop below the low of the covering candle (62.62p and 61.42p respectively).63.8p remains the key upside level to break. Original link...
Continue reading


