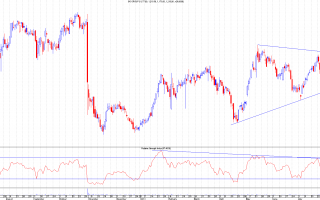
As expected, the rally off the intermediate trendline support failed and today the price has dropped below it (see previous post suggesting this may happen).A critical level is now not far away for BLVN. The main uptrend support from the Dec 2008 low of 20p sits at 61.8p today (rising slightly daily) and there is also price support at 62p and 63p from previous bounces. It will be very important for this level to hold as it's the main uptrend and has provided those recent bounces. You can see its importance on the weekly chart below: I'll be going long here with a tight stop. You can just see on the left side of the weekly chart that there's not a lot to stop this getting to 55p if 62p fails hence the tight stop. Original link...
Continue reading
Ophir Energy is currently trading near an area of multiple supports. There's a price support at 359p from Feb 2012, the gap at 366p from the same day and the down channel support all converging in the 359p area.Note also that the RSI is nearing its support trendline which adds further weight to the strength of this area. It could be worth going long at 357/8p (the channel support) with tight stops.If this level goes then the next supports are 330p and 290p but a breakdown of the channel would not be healthy without a swift re-entry (there can sometimes be false breakouts). The 412/4 level is the key one to break to the upside but we need to see a higher low first. Original link...
Continue reading
Sirius Minerals is still trading in No-Man's-Land and it's hard to know whether this is a bear flag or a choppy start to a new move up.One possible signal is that in the last few days the price made a higher low whereas RSI made a lower low. This is called a momentum discrepancy reversal point (MDRP) and in this case could signal a move up.Stiff resistance remains at the 28.75p to 30p area but if that breaks then price could move up quite rapidly as there's little resistance above there apart from the 36.75p all time high.Supports are at 22.5p, Original link...
Continue reading
Here's a very simple chart showing POG's failure to reach the targeted resistances due to the bear flag mentioned by Gary in the previous comments.If this channel breaks down then there's likely to be new lows to follow but 116p remains a support whilst resistances are at 147p, 154p and 164p. Original link...
Continue reading
San Leon formed an inside bar yesterday as shown in the highlighted circle. The usual way to trade these is in the direction that it moves out from the inside bar (with stops outside the limits of the covering bar).There appears to have been a nice 3 wave correction down to the 5.8p support and that area is now key - it needs to stay above there to avoid lower prices.On the upside, the level to watch is 6.75p - a close above that should signal a confirmation that the correction is over and higher prices should follow. Original link...
Continue reading


