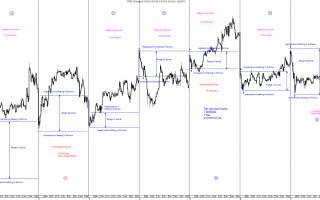
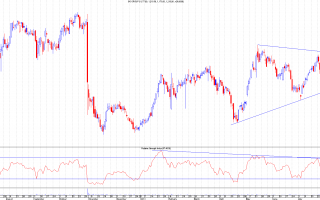
Today marked a higher low in the Dow Jones at the 78.6% Fib which could possibly signal that 14844 a few days ago was the bottom of the correction.I can't be sure of this yet, but based on the FTSE and S&P's charts it seems likely. In order to confirm this there now needs to be a break above 15300 to form a higher high and that will be our cue to go long. WIde stops would be needed however as volatility is very high in the indices now so we must be very careful as Original link...
Continue reading
A very simple chart today for the S&P500. It hit the uptrend support from the Nov lows again today at 1608 and a strong rise saw it find resistance at the short term downtrend.A break of either of these ought to signal further moves in the relevant direction. Note also that today formed a bullish engulfing candle so I favour the upside here after a retrace to half way down today's candle. Original link...
Continue reading
Right then. We closed today with a hammer on the daily chart. This is much more convincing than those from the 4H and hourly charts from yesterday, particularly because this time there was also a repeat of the 4H hammer but this time it followed through and was bought.I still have a number of concerns about whether this is genuine though. Firstly, it's still barely touched the 50% Fib and after such a strong downtrend and an uncertain move from 141p to 166p I'd still normally have expected a wave 2 to go below the 50% Fib.Secondly, volume again was weak and it didn't take a lot to push the SP up from 152p where it was trading only seconds before the close. In fact it took less than 10k to move it from 152.5 to 155p. Thirdly, the candle body is really a bit too large for a true hammer...
Continue reading
Interesting day here today. I went long just above the 61.8% Fib (forgot to place limit order so didn't get 98p exactly) because there was also support from the short term RSI trendline.I'm still unsure about whether this will break to new highs but I have a stop just below 98p and I will look to exit at a profit on the first sign that something's amiss. The main resistance to watch is that trendline which will be at the recent 113p high in a couple of days. Original link...
Continue reading
This worked out beautifully today and I went long at 63.25p. It's finished today with a perfect hammer right off that main trendline and horizontal support of 63p.Note how the long term RSI support came into play at exactly the same time lending weight to the move. In addition, after the initial bounce, price dropped back but were again bought confirming that the bears had lost this particular battle.What I'll look for now is for the RSI downtrend to be tested. A break through that and price ought to follow through its own trendline. For now, though, like any candle pattern, this needs confirming tomorrow. Resistances are at 73.25p, 76p and the 79-81p area Original link...
Continue reading


