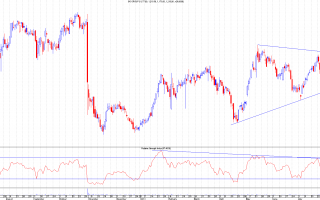
Just a quick one this morning to illustrate how the hourly RSI is still trading within the triangle and resistance came into play on the open again and the MACD histogram peaks are still trending down. Original link...
Continue reading
I've chosen to use a pure price chart for Heritage Oil for simplicity and because the indicators aren't showing my anything.Points to note here are the fact that it has retraced to between the 50 and 61.8% Fibs of the last rise which is enough for a typical wave 2; downtrend resistance lies at 156p today (was slightly higher at 156.25p yesterday) and the 123-low breakout level is at 161p.There was also a bullish engulfing candle yesterday so if this can close above 156p and 161p then higher prices may follow. Watch out for the gap at 170p and resistance at 190p. Original link...
Continue reading
If I understand correctly (please forgive me, Gary, if I've misinterpreted your comments on the last post) this weekly chart is what Gary's referring to with his possibility of a rise to the 168.5/169p area and then a retrace down to 115p all within June.If that works out (perfectly possible IMHO) then we'd have an ending diagonal triangle (wedge) which would allow for the wave 1/4 crossover.As you may know, my original thoughts were along these lines though without the wedge. In fact, this pattern would be more bullish than what I'd been thinking as ending diagonal triangles can produce quite violent moves (not always).This scenario would actually give me much greater confidence going forward as there would be a complete wave pattern down from 450p. As things currently stand, we don't have that which is why I'm finding it hard to have confidence in this rise from 126p (and...
Continue reading
The RSI breakdown followed through as expected yesterday with quite a bearish day back down to the short term uptrend support. I bought a few at this level yesterday as I posted in the comments on the last chart update but I'm not confident and will look to bail out on any further weakness.The 22.5p to 27.5p move in May seems very similar to that which is currently happening in XEL so it will be interesting to see if Xcite follows in the same way.One note of possible bullishness here: the RSI has made a new low whilst price has not yet. This could be what is known as a momentum discrepancy reversal point which is kind of the opposite of a bearish divergence and could be a pattern of continuance of the uptrend from 22.5p. There's plenty of short term support between 22.5p and 24p but if that gets...
Continue reading
Again POG tested the breakout point of 135p yesterday and held onto it. This level has to hold if it's going to continue upwards towards the target 154p area so I've moved my stops to jest below the low of the previous day's candle (31st May) of 134.1p. Original link...
Continue reading


