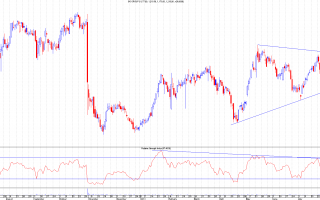
This has closed today with both the price and RSI breaking their short term uptrend supports which doesn't bode well.The last test of the RSI downtrend has proved decisive so until there's at least a break of that 6.6p level on a closing basis I won't go near this with a long position. Original link...
Continue reading
There's still no clear direction for XEL but a decisive break will have to come soon. The daily RSI is getting towards the apex of it's triangle, and price is also in a breakout zone in its own triangles.Key price levels are at the 92.5p gap and intermediate uptrend support, the recent 96.4p low, the short term uptrend support at 98.5p, the recent high at 106p and the key 113p level circled.The RSI should give us a clue which direction the price will go in so I'll still be watching where that closes. I'd like to see that short term uptrend hold but the 92.5p gap offers a great entry possibility with a nice tight stop below 88.75p. If that fails then there's the main trendline at 83.75p. Original link...
Continue reading
At last there's a signal for a possible move here with a breakout of the daily RSI. My only reservation about this is the fact that the RSI trendline didn't come from a bearish divergence which is my usual criteria for this trade.The SP closed today at 104p which is historically a significant level. On its own that tells us nothing but if it can close above 106p then there will have been a breakout to a higher high following a higher low (I'm referring to the pattern since the 96.4p low).Real strength will only come on a break of 113p as that will form a significant higher high and a trendline break. Original link...
Continue reading
XEL seems to be following through nicely following the RSI breakout with a bullish marubozu today and a close at the day's high, right at the 106p breakout level.Note also how the RSI backtested and bounced (circled). I usually prefer this test to be after a number of days rather then so quickly but as long as the RSI maintains this uptrend, and especially if it can get > 70 then there's a chance of a test of the trendline resistance , 113p and a possible breakout. We should be OK to move stops to below today's low but bel Original link...
Continue reading
Today was the 3rd inside bar in a row for XEL but with lower highs and a 104.5/104.25p low each day it's looking a lot like a small descending triangle to me which suggests it will break down, probably tomorrow.If so, the target would be about 5p so around the 99p mark. However, we should not assume that it will break down but wait to see which way it does break and then trade that direction. More importantly, we have the uptrend and downtrends converging imminently so they will decide the short/medium term direction. Original link...
Continue reading


