


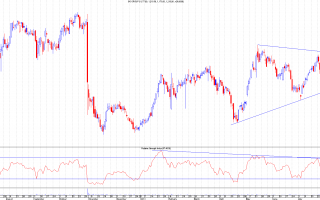
Tricky one this. Clearly price has dropped through the trendline however the RSI has closed on its trendline which formed from the bullish divergence. Often, but not always, this can be a sign of a false breakout so there's still a chance it could reverse from here. If the RSI follows it down then that's unlikely until at least the lower trendline IMHO.There's a clear "cup" type formation with the "rim" at 113p so it may be worth looking to see if a handle forms - the RSI, currently suggests it could - back up to 112/3p which would target c. 130p if it occurs. Below 96p and the lower trendline and the drop could get nasty so make sure you have stops in place below the important 96p Original link...
Continue reading
-
1 Hour Trading System - Day 1
Trading Systems Trading systems have been used all over the world for centuries, why are they so popular you may ask? Well it's because of the many benefits the trading systems provide such as providing entry and exit points, taking the emotion out
-
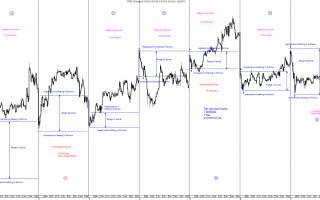
Share Tips from 4th November-1st December 2013
This blog is an update from the share tips from 4th November to 1st December 2013 from the Premium Section called Share Tips.There was a possible 2000+ points profit to have been made.This obviously assumes the max possible and some of these shares h

In a departure from my usual Updata charts, here's the updated (no pun intended) daily chart for Xcite Energy.As I previously mentioned, the key to this was not the price trendline but the RSI trendline formed from the bullish divergence. We got the bounce yesterday with a doji candle in the price chart and these have both followed though nicely today to the extent that it managed to close back above the short term price uptrend.This is a classic false breakout and shows how important it is to use RSI in conjunction with price to help avoid getting caught out. I'm now long on this with a tight stop below 101p. My initial target will be the 112/3p resistance but if it does get back there then there will be a nice cup and handle pattern which should target 130p and then beyond when we consider the ascending triangle from...
Continue reading

OK, so $1265 wasn't the bottom for gold and I missed the bounce, however, there was a good opportunity to go short again on this based on a simple backtest of the previous support (breakdown) level at $1268.9 (I did post on the POG comments that I intended to short this here).The next major support is at $1157 and is shown on the weekly chart to the left. Here we see that $1157 is actually a double support and it's therefore really quite important that it holds or it could go a fair bit lower quite quickly - it's the weekly low from July 2010 (which formed a weekly hammer which resulted in a breakout to the all time high) and also the 61.8% Fib of the entire move up from $682 lows in Oct 2008.Ultimately, this could go lower than even this level but we'll concentrate on this for...
Continue reading

I'm looking to short gold at $1320 as there are 2 levels of resistance there and a 3rd at $1337.9 so my stop will be above that one.There's the initial price low from the big drop and the short term downtrend resistance, plus the 61.8% Fib of the last drop at at around the $133o mark so that makes 4 resistances in a pretty short price range. The target will be the strong support around the $1170 level previously discussed. Original link...
Continue reading

OPHR is clinging on precariously to its channel support and is yet to close below it. Having said that, the possible higher low failed and there's yet to be another so the downtrend prevails for now.There are, however, multiple bullish divergences (not only in the RSI shown) which suggests that the current move to lower prices is weak. Yesterday's inside bar broke to the downside intraday today but closed above the key level which also suggests there's little appetite for lower prices here.I'll still wait for a higher low to form given the length of the downtrend and then I'll look to trade either that or the following Original link...
Continue reading
