Tonight I thought we'd take a different view and look at the daily cloud chart because there have been some interesting developments lately. For more information on cloud, or Ichimoku, charts please click here. If we look to the left of the chart we can see how prices dropped below the cloud then re-entered and tested the top of the cloud from the inside. This is a classic resistance test and the breakdown was confirmed by prices dropping straight back down out of the cloud followed by the blue lagging line. This is textbook Ichimoku charting for a downtrend confirmation.The last few days, however, and seen an exact (in fact even better) reverse event. Price broke up through the cloud to the 180p high, re-entered the cloud to test the support at the base and then popped straight back up out of the cloud. In addition (and this is what makes...
Continue reading
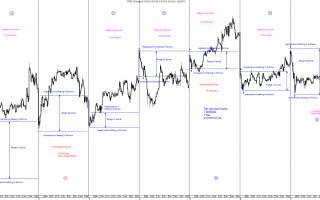
Caveat and disclaimer first: This post is purely specualtive, based on EWT (with a bit of adjustment for key levels) and none of the levels may actually generate the projected action shown. In addition there has been no attempt to accurately portray timescales for these possible moves. This is merely to illustrate what could happen if theory plays out. It's also subject to a close and hold above 180p and conditional on not going below 151.25p beforehand.Also, wave 2 should be at 138.5p but because this is a weekly chart that detail has been lost. The same applies to the 230p gap which remains on the daily chart.What I've done here is to plot the horizontal blue lines of price resistance. These are at 218p, 230p and 260p. There are also resistances at 189p and, of course, 180p. Then I've plotted the Fib extension for (circled) wave iii. This is...
Continue reading
Just a quick update tonight as there are quite a few other good looking shares out there at the moment, particularly amongst the gold miner sector.For the second day running the price closed bang on the downtrend form the 260p high thereby continuing the uncertainty about the immediate future direction of the price.I'll be looking for the 169p area to hold if there is a further retrace. If it doesn't (and particularly if 166p goes again) then it's likely that the bear case will take control. It did put on 33p in a week and nearly 50% since the 126p low so it's unsurprising that there's been some profit taking here. Original link...
Continue reading
Here we have today's closing daily chart showing quite a few trendlines, supports and resistances.The first thing to note is that it closed back inside the uptrend support from the 129.25p low so that support remains in tact for now at least.I've also slightly re-drawn the downtrend resistance from the 260p high to take account of the recent 184.75p high though I still believe that a close above 180/2p (which we haven't yet had) is more important.As can be seen, support was found today at the original breakout point of this move up which was 158p and the fact that price closed back inside the uptrend, having dropped a fair way out of it, it bullish IMHO.Generally there seems to be two main ways of viewing the whole post-126p sequence: the camp that views at as a big bearish wedge which appeared to be the source of the resistance at...
Continue reading
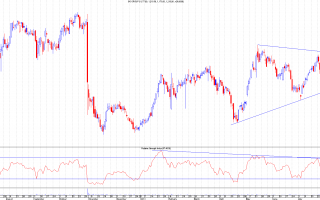
If I was in a risk-taking mood I might buy this due to the RSI breakout but it would be a risk as price got rejected from the short term downtrend and the main downtrend is still some distance away.The gap at 5p got filled nicely and there's been a decent bounce to produce that RSI breakout so a close above 6.65p (the previous high) would give a higher high after the higher low at the gap.There's still that downtrend and 7.88p to deal with but it might be starting to get interesting here. Original link...
Continue reading


