Amur Minerals is still finding 9p resistance tough to break but it has closed above the RSI downtrend resistance on Friday and looks to be in either an ascending triangle or inverse head and shoulders pattern.If it can close above 9p both of these patterns point towards a target of c. 13.5p. A return to the 6.75p support would be bearish though and indicate further downside as it would break the inverse H&S pattern. ...
Continue reading

AMC made a new high today and looked for all money that it would close above the key 9.5p level.It didn't, however, but it still looks bullish with 2 closes in 3 days above 9p. It just needs that close over 9.5p to kick on. Still a hold for me. ...
Continue reading
AMC finally broke out and closed above the 9/9.5p resistance and looks to have backtested that level intraday.The target for this move is 13.5p based on the inverse H&S with a range of 4p from the 9.5p neckline.There are resistance at 12.25p and 14p too. ...
Continue reading
Essar Energy took a nice trendline bounce today suggesting that this trend is still in good shape. It's also a higher low so a 123-low trade could beckon on a break of the earlier bounce high at 146.7p.This would be the cue to go long targeting the 155p and 164.5p resistances. Stops should be below today's low. ...
Continue reading
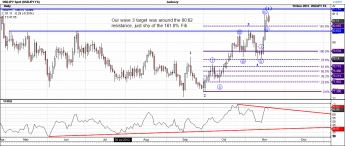
Here's a follow-up to the earlier piece on the USDJPY live example for the EWT/Fib theory.
Remember, we were looking at a 161.8% Fib extension target for wave 3 up at 80.85 but we knew there was firm resistance at 80.62 which would probably come into play. We were then looking at a possible retrace to the wave 1 high at 79.22 for the wave 4 retrace before continuing up to test the 81.78 reistance for wave 5. Here's what happened:
dl.dropbox.com/u/20815047/USDJPYdaily19_11_12a.gif
As we can see, that resistance came into play perfectly with a bearish RSI divergence too so this was a good place to go short. The wave 4 down turned out to be slightly anomalous though:
dl.dropbox.com/u/20815047/USDJPYdaily19_11_12b.gif
We were looking to the 38.2% Fib or the top of wave 1 to act as support. In fact it retraced to precisely the 50% Fib which entered wave 1...
Continue reading


