EWT and Fibs - USDJPY live example pt.2
in ChartsView Blog:- Font size: Larger Smaller
- Hits: 16851
- 0 Comments
- Subscribe to this entry
- Bookmark
Here's a follow-up to the earlier piece on the USDJPY live example for the EWT/Fib theory.
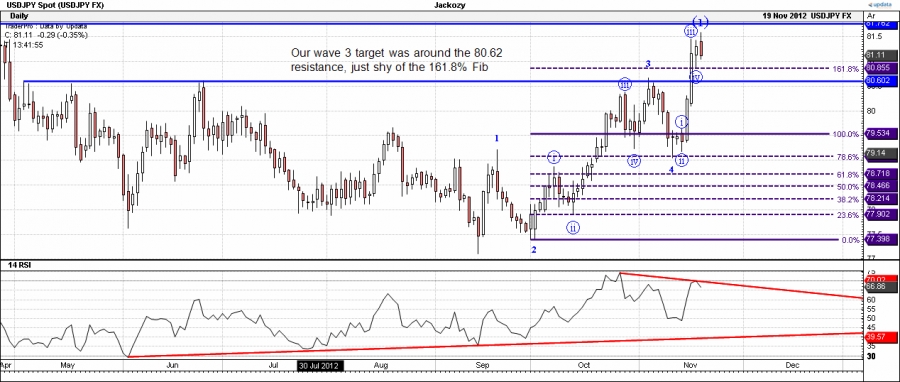
Remember, we were looking at a 161.8% Fib extension target for wave 3 up at 80.85 but we knew there was firm resistance at 80.62 which would probably come into play. We were then looking at a possible retrace to the wave 1 high at 79.22 for the wave 4 retrace before continuing up to test the 81.78 reistance for wave 5. Here's what happened:
dl.dropbox.com/u/20815047/USDJPYdaily19_11_12a.gif
As we can see, that resistance came into play perfectly with a bearish RSI divergence too so this was a good place to go short. The wave 4 down turned out to be slightly anomalous though:
dl.dropbox.com/u/20815047/USDJPYdaily19_11_12b.gif
We were looking to the 38.2% Fib or the top of wave 1 to act as support. In fact it retraced to precisely the 50% Fib which entered wave 1 territory. We'll return to this apparent break of EWT rules later. Having bounced off the 50% retracement of wave 3, it began a very swift wave 5 up. Our target for this was between the wave 5 = wave 1 level of 81.157 and the natural resistance at 81.78 and that's what happened:
dl.dropbox.com/u/20815047/USDJPYdaily19_11_12.gif
It's a little dangerous to assume that the top has formed here as it's too early to tell but the current peak does fit well with theory. There also appears to be another bearish RSI divergence forming between the wave 3 and 5 peaks, just as we'd expect (the earlier bearish RSI divergence at 80.62 often occurs between the 3rd and 5th subwaves of wave 3). However, we still have the unresolved matter of the wave 1/4 overlap to consider...
dl.dropbox.com/u/20815047/USDJPYdaily19_11_12c.gif
In fact, EWT does allow for a wave 1/4 overlap in the event of a diagonal triangle. These can be either a leading diagonal wave 1 (as this would be) or an ending diagonal wave 5. In both cases they represent weak impulse waves and are usually followed by strong retraces to at least the 61.8% level and sometimes a full retrace.
As we can see from the above chart, it's possible that USDJPY has formed a leading diagonal triangle with an overshoot for the 5th subwave of it. Elliott did note that the 5th subwave of all triangle formations can often overshoot and extend beyond the triangle boundary so the fact the this happened here does not rule out the leading diagonal possibility. Further, the bearish nature of both the wave 2 and wave 4 retraces suggest that the whole move has a bearish quality about it so perhaps this is not a surprise.
The other possibility, of course, is that the wave count here is wrong and that an alternative may need to play out. Time will tell, but for now this live example has apparently conformed quite well to EWT and Fib theory. From a practical point of view, when the theory has been adjusted to account for nearby natural supports and resistances it's provided a very good trading opportunity and, let's face it, that's really our primary concern here and we will continue to monitor this FX pair as it plays out.