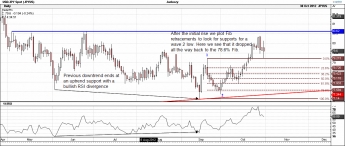
Here we're going to look at a live example of this theory in action. Prices almost never perform precisely to TA theory so please view this post as educational rather than a trading tip.
USDJPY had been in a downtrend which ended at a known uptrend support with a bullish RSI divergence. We've seen an initial rise and retrace so we can see how the theory matched up:
dl.dropbox.com/u/20815047/USDJPYexample1.gif
We can see it dropped to the 78.6% Fib so we plot the Fib extensions from there to give us resistances on the way up to a wave 3 target:
dl.dropbox.com/u/20815047/USDJPYexample2.gif
We have not (so far) reached that target so the rest is theoretical. The wave 3 target from the Fib extensions comes in very close to a known, strong resistance level so it seems a good place to trade from. We can then theorise as to how the rest of...
Continue reading

Here we have a sequence of charts showing a theoretical 5 "perfect" Elliott Waves up.
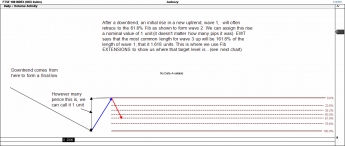
We start by assuming the share has been in a downward trend, forms a final low and then begins a new trend up with wave 1:
dl.dropbox.com/u/20815047/EWTwaves1%2C2.gif
This wave 1 up ought to also consist of a sequence of 5 smaller degree waves up but we'll leave that for now. The main point here is that the initial wave 1 up will often be followed by quite a severe retracement, usually to the 61.8% Fib level. This is thought to be due to the collective psyche still being unsure about the new trend causing many to take profits early having been trapped in the previous downtrend.
Following this retracement, price begin to look quite cheap again near to the previous downtrend low and traders buy this level since it represents good value compared to all of...
Continue reading


