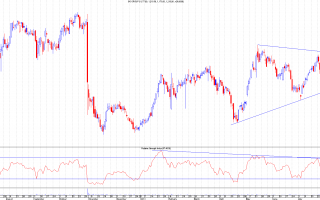
I've got to say this this was a bit of a surprise move yesterday and seemed to come on very little volume though I was only able to watch on my phone as I was out all day.The volatility and relatively low volumes makes this a but tricky and not so reliable, but note how that 61.8% Fib held almost exactly (that's where it went into auction surprise, surprise) and then subsequently got sold off.I'm afraid I still can't help the feeling that the move from 88.75p is corrective (ie against the trend), especially given it's current and apparent 3 wave form, preceeded by what appeared to be 5 waves down [5 wave move are always in the direction of the current main trend but can also be the last move of that trend].Downtrend resistance from the 250p high is at 116.5p today so that's the initial upside figure to...
Continue reading
Vodafone has followed through nicely here and is close to my initial target at the 38.2% Fib and gap at 185p.I was thinking of going long at that point but there's a chance that this could go much lower based on the whole move up from Oct 2008 lows at 96p appearing to be complete so I think I'll give that a miss now and review it as we go. Original link...
Continue reading
Here's the daily chart going right back to the start of the last downtrend at 228p. We can clearly see how it traded in a channel until the day it broke the main uptrend support (no longer shown) and the 161p support on 22nd April when TK transferred his 10mm shares.The lower dotted line is almost exactly another channel width away and we can see how that then became support which ultimately coincided with the uptrend from the 64p and 87p lows shown earlier on a weekly chart. The rise since 126p has travelled all the way back both channels and found the expected resistance at 165p where the channel top meets the 38.2% Fib. This move looks very much like it has 5 subwaves which is suggests that this in the new trend direction. The last of these 5 subwaves has a messy appearance in a wedge shape as noted...
Continue reading
A pure price chart here of the FTSE100 showing yesterday's bounce off the short term uptrend support and today's drop back down to it.This support is probably going to get broken as the Dow and S&P500 still have further to drop in this correction IMHO. It's not a major support trendline though so not a big deal. Perhaps just a drop to the last breakout point from the March high at 6534? Original link...
Continue reading
The best view of this is on the weekly chart as it's been largely sideways for so long. Here we can see that the move up on Monday broke the main downtrend and there appears to have been a backtest of that trendline break yesterday which has so far held.May be worth going long with a stop below yesterday's low of 12.3p. There's also the previous high of 13p which, if it holds, could act as support. If it goes below that 12.3p then it's probably a false breakout hence the need for a stop loss just below there.Shares like this are very risky as they're so volatile so they need to be treated with extreme caution. Original link...
Continue reading


